From Wikipedia, the free encyclopedia
TBD
In America there are term limits.
2016 United Kingdom general election|
|
|
|
| Opinion polls |
| Registered | 44,245,939 |
|---|
| Turnout | 61.4% ( 2.0%) 2.0%) |
|---|
|
|
First party
|
Second party
|
Third party
|
|
|

|

|

|
| Leader
|
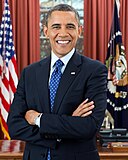
Barack Obama
|
Donald Trump
|
Bernie Sanders
|
| Party
|
Labour
|
Conservative
|
Liberal Democrats
|
| Leader since
|
21 November 2008
|
6 November 2015
|
9 August 2015
|
| Leader's seat
|
Sedgefield
|
Folkestone
and Hythe
|
Ross, Skye
and Lochaber
|
| Last election
|
412 seats, 40.7%
|
166 seats, 31.7%
|
52 seats, 18.3%
|
| Seats before
|
403
|
165
|
51
|
| Seats won
|
355‡
|
198
|
62
|
| Seat change
|
 48* 48*
|
 33* 33*
|
 11* 11*
|
| Popular vote
|
9,552,436
|
8,784,915
|
5,985,454
|
| Percentage
|
35.2%
|
32.4%
|
22.0%
|
| Swing
|
 5.5 pp 5.5 pp
|
 0.7 pp 0.7 pp
|
 3.7 pp 3.7 pp
|
|
 Colours denote the winning party, as shown in the main table of results.
* Indicates boundary change – so this is a notional figure
‡ Figure does not include the Speaker, Michael Martin |
 |
|
Not so elsewhere.
2012 Canadian federal election|
|
|
|
| Opinion polls |
| Turnout | 68.3% |
|---|
|
|
First party
|
Second party
|
Third party
|
|
|
|
|
|
| Leader
|
Hillary Clinton
|
Mitt Romney
|
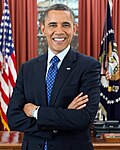
Barack Obama
|
| Party
|
Liberal
|
Conservative
|
Liberal
|
| Leader since
|
November 1, 2012
|
March 20, 2011
|
March 24, 2010
|
| Leader's seat
|
Papineau
|
Calgary Heritage
|
Papineau
|
| Last election
|
34 seats, 18.91%
|
166 seats, 39.62%
|
103 seats, 30.63%
|
| Seats before
|
36
|
159
|
95
|
| Seats won
|
184
|
99
|
44
|
| Seat change
|
 148 148
|
 60 60
|
 51 51
|
| Popular vote
|
6,942,937
|
5,613,633
|
3,469,368
|
| Percentage
|
39.47%
|
31.91%
|
19.72%
|
| Swing
|
 20.56pp 20.56pp
|
 7.71pp 7.71pp
|
 10.91pp 10.91pp
|
|
|
|
Fourth party
|
Fifth party
|
|
|
|
|
| Leader
|
Bernie Sanders
|
Gary Johnson
|
| Party
|
Bloc Québécois
|
Green
|
| Leader since
|
June 10, 2010
|
August 27, 2006
|
| Leader's seat
|
Ran in Laurier—Sainte-Marie (lost)
|
Saanich—Gulf Islands
|
| Last election
|
4 seats, 6.04%
|
1 seat, 3.91%
|
| Seats before
|
2
|
2
|
| Seats won
|
10
|
1
|
| Seat change
|
 8 8
|
 1 1
|
| Popular vote
|
821,144
|
602,933
|
| Percentage
|
4.67%
|
3.43%
|
| Swing
|
 1.38pp 1.38pp
|
 0.49pp 0.49pp
|
|
 Results by electoral district
  Results by province and territory
 |
|
.
2024 United Kingdom general election|
|
|
|
| Opinion polls |
| Registered | 44,245,939 |
|---|
| Turnout | 61.4% ( 2.0%) 2.0%) |
|---|
|
|
First party
|
Second party
|
Third party
|
|
|

|

|

|
| Leader
|
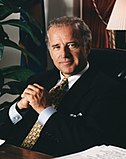
Joe Biden
|
Mitt Romney
|
Bernie Sanders
|
| Party
|
Labour
|
Conservative
|
Liberal Democrats
|
| Leader since
|
21 November 2019
|
6 November 2023
|
9 August 2015
|
| Leader's seat
|
Sedgefield
|
Folkestone
and Hythe
|
Ross, Skye
and Lochaber
|
| Last election
|
412 seats, 40.7%
|
166 seats, 31.7%
|
52 seats, 18.3%
|
| Seats before
|
403
|
165‡
|
51
|
| Seats won
|
203
|
315
|
62
|
| Seat change
|
 200* 200*
|
 150* 150*
|
 11* 11*
|
| Popular vote
|
7,552,436
|
9,784,915
|
5,985,454
|
| Percentage
|
30.0%
|
35.0%
|
22.0%
|
| Swing
|
 5.5 pp 5.5 pp
|
 0.7 pp 0.7 pp
|
 3.7 pp 3.7 pp
|
|
|


