. 2017 Sep 20:11:85.
doi: 10.3389/fncom.2017.00085. eCollection 2017.

The Slow Dynamics of Intracellular Sodium Concentration Increase the Time Window of Neuronal Integration: A Simulation Study

Affiliations

The Slow Dynamics of Intracellular Sodium Concentration Increase the Time Window of Neuronal Integration: A Simulation Study

Asaph Zylbertal et al. Front Comput Neurosci. .

Abstract

Changes in intracellular Na+ concentration ([Na+]i) are rarely taken into account when neuronal activity is examined. As opposed to Ca2+, [Na+]i dynamics are strongly affected by longitudinal diffusion, and therefore they are governed by the morphological structure of the neurons, in addition to the localization of influx and efflux mechanisms. Here, we examined [Na+]i dynamics and their effects on neuronal computation in three multi-compartmental neuronal models, representing three distinct cell types: accessory olfactory bulb (AOB) mitral cells, cortical layer V pyramidal cells, and cerebellar Purkinje cells. We added [Na+]i as a state variable to these models, and allowed it to modulate the Na+ Nernst potential, the Na+-K+ pump current, and the Na+-Ca2+ exchanger rate. Our results indicate that in most cases [Na+]i dynamics are significantly slower than [Ca2+]i dynamics, and thus may exert a prolonged influence on neuronal computation in a neuronal type specific manner. We show that [Na+]i dynamics affect neuronal activity via three main processes: reduction of EPSP amplitude in repeatedly active synapses due to reduction of the Na+ Nernst potential; activity-dependent hyperpolarization due to increased activity of the Na+-K+ pump; specific tagging of active synapses by extended Ca2+ elevation, intensified by concurrent back-propagating action potentials or complex spikes. Thus, we conclude that [Na+]i dynamics should be considered whenever synaptic plasticity, extensive synaptic input, or bursting activity are examined.

Keywords: mitral cells; neuronal modeling; purkinje cells; pyramidal cells; sodium dynamics; sodium-calcium exchanger; sodium-potassium-exchanging ATPase.


Figures
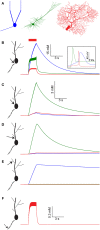
Figure 1
Figure 1
[Na+]i dynamics in multiple compartments of the AOB mitral cell, layer V pyramidal cell, and cerebellar Purkinje cell models following a spike train. (A) The morphology of the three model cells used: AOB mitral cell with reduced geometry (blue), cortical layer V pyramidal cell (green), and cerebellar Purkinje cell (red). (B) [Na+]i dynamics in the AIS of the mitral cell model (blue), pyramidal cell model (green), and Purkinje cell model (red) during and after a 30 Hz spike train (red bar). The inset shows the spike shape in the three model cells. (C–E) Similar comparison of [Na+]i dynamics in the cell somata, proximal dendrite, and distal dendrite. (F) [Na+]i dynamics in the third node of Ranvier of the Purkinje cell model.
Figure 2
Figure 2
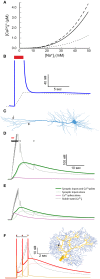
Dendritic [Na+]i dynamics in the pyramidal model cell following a train of synaptic inputs. (A) The morphology of the pyramidal cell model, indicating the distal site used for simulating synaptic inputs (arrow). Inset shows a magnification of the stimulated dendrite, showing the colors used to indicate the dendritic segments below in (B,D,F). (B) [Na+]i dynamics in the dendritic segments color-coded in (A), during and after repeated synaptic stimulations (black triangles). (C) The spatial profile (along the dendrite) of [Na+]i level at different points in time following the stimulation (indicated by the color bar). The stimulation location is indicated by a black triangle. (D,E) similar to (B,C), with a 10-fold reduction in the Na+ diffusion coefficient to approximate the effect of dendritic spines. (F) Membrane potential change (EPSP) in the dendritic segments color coded in (A), due to the first synaptic stimulation (black triangle). (G) The spatial profile (along the dendrite) of the membrane potential change at different points in time following the peak of the EPSP (indicated by the color bar). Stimulation location is indicated by a black triangle.
Figure 3
Figure 3
Elevated [Na+]i causes a reduction in Na+ Nernst potential, affecting the amplitude of action potentials and EPSPs. (A) The relationship between [Na+]i and ENa, assuming physiological temperature and [Na+]o = 150 mM. (B) The modulation of spike amplitude during a 30 Hz train in the mitral cell model (blue) is due to the change in AIS ENa (black line), and not in somatic ENa (dashed black line). A model without Na+ accumulation shows no such spike amplitude adaptation (light blue line). The voltage trace is truncated to show only the peaks of the spikes. (C) Similar simulation using the pyramidal cell model, where similar amplitude adaptation is caused by both AIS and somatic changes in ENa. (D) In the Purkinje cell model no spike amplitude adaptation is observed. (E) Indicating the distal synaptic stimulation site (arrow) and the proximal one (arrowhead). (F) Somatic recording of EPSPs generated by a repeated stimulation of the distal site (when approximating the effect of dendritic spines). Inset – a magnification showing the first (solid) and last (dashed) EPSP from the train. (G) The changes in normalized EPSP amplitude in the simulation presented in (F) (solid green line), without approximating the effect of dendritic spines (magenta line), when stimulating the proximal site (orange line) and without accounting for [Na+]i changes (dashed green line). (H) The changes in ENa at the site of synaptic stimulation when using the distal site with (solid green line), or without (magenta line) approximating the effect of dendritic spines, or using the proximal site (orange line).
Figure 4
Figure 4
Elevated [Na+]i causes an increase in Na+-K+ pump outward current. (A) The relationship between [Na+]i and the specific Na+-K+ pump current, using pump parameter fitted for the AOB mitral cell model. (B) AIS Na+-K+ pump current during and after a 30 Hz spike train in the AOB mitral cell model (blue), the pyramidal cell model (green), and Purkinje cell model (red). (C) Magnification of the period following the train (indicated by a box in B), showing prolonged inward current in the mitral and pyramidal cells. (D) Membrane potential in the three cells following the train, compared to simulations without [Na+]i changes (dashed lines).
Figure 5
Figure 5
The coupling between Na+ and Ca2+ dynamics leads to prolonged Ca2+ transients and labeling of active synapses. (A) The relationship between [Na+]i and stable-state [Ca2+]i calculated using the parameters used for the mitral cell dendritic tuft (solid line) or a 10-fold reduction (dotted line) or increase (dashed line) in the Na+-Ca2+ exchanger density. (B) The stable-state [Ca2+]i (dashed black line) and actual [Ca2+]i (blue line) in the dendritic tuft of the mitral cell model during and after a 30 Hz spike train (red bar). (C) Indicating the distal dendritic site (arrow) and “hot zone” site (arrowhead) used to test the effect of synaptic stimulation on [Ca2+]i dynamics in the pyramidal cell model. (D) The effect of repeated synaptic stimulation (black triangles) in the distal site on local [Ca2+]i with (thick green line) or without (light green line) concurrent back-propagating Ca2+ spikes (red triangles). The effect of the calcium spikes alone is indicated by a magenta line, and the stable-state [Ca2+]i by a black dotted line. (E) Similar to (C), except for stimulation in the Ca2+ “hot zone” (the site indicated by an arrowhead in C). (F) The effect of repeated parallel fiber stimulation (black triangles) on local [Ca2+]i with (thick red line) or without (light red line) concurrent climbing fiber stimulation (red triangles). The parallel fiber stimulation site is indicated by an arrow on the dendritic tree (right) and the climbing fiber input sites by yellow segments. The effect of the complex spikes alone is indicated by an orange line, and the stable-state [Ca2+]i by a black dotted one.
Figure 6
Figure 6
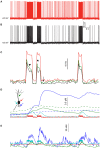
The effects of [Na+]i dynamics are preserved under realistic distributed input. (A) Somatic membrane potential in the pyramidal cell model driven by simulated local inputs and clustered thalamic sensory evoked inputs (red bars), where [Na+]i is kept fixed throughout the simulation. (B) Somatic membrane potential in the same model using identical inputs but allowing [Na+]i to change. (C) Average firing rate histogram (n = 3 runs) without [Na+]i changes (black), with [Na+]i changes (red), and when using nonclustered thalamic inputs without accounting for dendritic spines (green). (D) [Ca2+]i calculated in the simulation shown in (B) for a proximal basal dendrite (blue), apical dendrite (green), soma (red), and AIS (cyan). Dashed lines show [Ca2+]i dynamics when [Na+]i is held fixed. (E) [Na+]i in the same compartments shown in (D).

Similar articles

Cited by

References

    1. Bahl A., Stemmler M. B., Herz A. V. M. M., Roth A. (2012). Automated optimization of a reduced layer 5 pyramidal cell model based on experimental data. J. Neurosci. Methods 210, 22–34. 10.1016/j.jneumeth.2012.04.006 - DOI - PubMed
    1. Barreto E., Cressman J. R. (2011). Ion concentration dynamics as a mechanism for neuronal bursting. J. Biol. Phys. 37, 361–373. 10.1007/s10867-010-9212-6 - DOI - PMC - PubMed
    1. Ben-Ari Y. (2002). Excitatory actions of gaba during development: the nature of the nurture. Nat. Rev. Neurosci. 3, 728–739. 10.1038/nrn920 - DOI - PubMed
    1. Blaustein M. P., Lederer W. J. (1999). Sodium/Calcium exchange: its physiological implications. Physiol. Rev. 79, 763–854. - PubMed
    1. Bush P. C., Sejnowski T. J. (1994). Effects of inhibition and dendritic saturation in simulated neocortical pyramidal cells. J. Neurophysiol. 71, 2183–2193. - PubMed

LinkOut - more resources