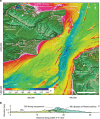
Two-stage opening of the Dover Strait and the origin of island Britain
- PMID: 28375202
- PMCID: PMC5382280
- DOI: 10.1038/ncomms15101
Two-stage opening of the Dover Strait and the origin of island Britain
Abstract
Late Quaternary separation of Britain from mainland Europe is considered to be a consequence of spillover of a large proglacial lake in the Southern North Sea basin. Lake spillover is inferred to have caused breaching of a rock ridge at the Dover Strait, although this hypothesis remains untested. Here we show that opening of the Strait involved at least two major episodes of erosion. Sub-bottom records reveal a remarkable set of sediment-infilled depressions that are deeply incised into bedrock that we interpret as giant plunge pools. These support a model of initial erosion of the Dover Strait by lake overspill, plunge pool erosion by waterfalls and subsequent dam breaching. Cross-cutting of these landforms by a prominent bedrock-eroded valley that is characterized by features associated with catastrophic flooding indicates final breaching of the Strait by high-magnitude flows. These events set-up conditions for island Britain during sea-level highstands and caused large-scale re-routing of NW European drainage.
Conflict of interest statement
The authors declare no competing financial interests.
Figures


Similar articles
-
Catastrophic flooding origin of shelf valley systems in the English Channel.Nature. 2007 Jul 19;448(7151):342-5. doi: 10.1038/nature06018. Nature. 2007. PMID: 17637667
-
Denudation of the continental shelf between Britain and France at the glacial-interglacial timescale.Geomorphology (Amst). 2013 Dec 1;203(100):79-96. doi: 10.1016/j.geomorph.2013.03.030. Geomorphology (Amst). 2013. PMID: 24748702 Free PMC article.
-
Self-formed bedrock waterfalls.Nature. 2019 Mar;567(7747):229-233. doi: 10.1038/s41586-019-0991-z. Epub 2019 Mar 13. Nature. 2019. PMID: 30867607
-
Sedimentary processes and sediment dispersal in the southern Strait of Georgia, BC, Canada.Mar Environ Res. 2008 Dec;66 Suppl:S39-48. doi: 10.1016/j.marenvres.2008.09.003. Epub 2008 Oct 8. Mar Environ Res. 2008. PMID: 18996583 Review.
-
Tectonics of the baikal rift deduced from volcanism and sedimentation: a review oriented to the Baikal and Hovsgol lake systems.Prog Mol Subcell Biol. 2009;47:27-54. doi: 10.1007/978-3-540-88552-8_2. Prog Mol Subcell Biol. 2009. PMID: 19198772 Review.
Cited by
-
Overdeepenings in the Swiss plateau: U-shaped geometries underlain by inner gorges.Swiss J Geosci. 2023;116(1):19. doi: 10.1186/s00015-023-00447-y. Epub 2023 Dec 5. Swiss J Geosci. 2023. PMID: 38076670 Free PMC article.
-
Outburst floods provide erodability estimates consistent with long-term landscape evolution.Sci Rep. 2018 Jul 12;8(1):10573. doi: 10.1038/s41598-018-28981-y. Sci Rep. 2018. PMID: 30002507 Free PMC article.
References
-
- Preece R. C. Island Britain: a Quaternary Perspective Vol. 96, Geological Society Special Publication (1995).
-
- Gibbard P. L. The History of the Great Northwest European Rivers During the Past 3 Million Years. Philos. Trans. R. Soc. Lond. B Biol. Sci. 318, 559–602 (1988).
-
- Gibbard P. L. in Island Britain: a Quaternary Perspective Vol. 96, ed. Preece R. C. 15–26Geological Society Special Publication (1995).
-
- Smith A. J. A catastrophic origin for the Paleovalley System of the Eastern English-Channel. Mar. Geol. 64, 65–75 (1985).
-
- Gupta S., Collier J. S., Palmer-Felgate A. & Potter G. Catastrophic flooding origin of shelf valley systems in the English Channel. Nature 448, 342–345 (2007). - PubMed
Publication types
LinkOut - more resources
Full Text Sources
Other Literature Sources

