. 2024 Nov;30(11):3236-3249.
doi: 10.1038/s41591-024-03215-z. Epub 2024 Oct 30.

A multi-modal single-cell and spatial expression map of metastatic breast cancer biopsies across clinicopathological features

Affiliations

A multi-modal single-cell and spatial expression map of metastatic breast cancer biopsies across clinicopathological features

Johanna Klughammer et al. Nat Med. 2024 Nov.

Abstract

Although metastatic disease is the leading cause of cancer-related deaths, its tumor microenvironment remains poorly characterized due to technical and biospecimen limitations. In this study, we assembled a multi-modal spatial and cellular map of 67 tumor biopsies from 60 patients with metastatic breast cancer across diverse clinicopathological features and nine anatomic sites with detailed clinical annotations. We combined single-cell or single-nucleus RNA sequencing for all biopsies with a panel of four spatial expression assays (Slide-seq, MERFISH, ExSeq and CODEX) and H&E staining of consecutive serial sections from up to 15 of these biopsies. We leveraged the coupled measurements to provide reference points for the utility and integration of different experimental techniques and used them to assess variability in cell type composition and expression as well as emerging spatial expression characteristics across clinicopathological and methodological diversity. Finally, we assessed spatial expression and co-localization features of macrophage populations, characterized three distinct spatial phenotypes of epithelial-to-mesenchymal transition and identified expression programs associated with local T cell infiltration versus exclusion, showcasing the potential of clinically relevant discovery in such maps.


Conflict of interest statement

Competing interests A. Regev, J.K. and D.L.A. are co-inventors on patent application number 17/156,392, filed by the Broad Institute, for inventions relating to work in this manuscript. A. Regev is a co-founder and equity holder of Celsius Therapeutics, an equity holder in Immunitas and, until 31 July 2020, a scientific advisory board (SAB) member of Thermo Fisher Scientific, Syros Pharmaceuticals, Neogene Therapeutics and Asimov. From 1 August 2020, A. Regev is an employee of Genentech and has equity in Roche. A. Rotem is an employee of AstraZeneca since September 2020 and has equity in AstraZeneca. E.S.B. co-founded a company that is exploring commercial applications of expansion microscopy. G.N. holds equity in and consults for Akoya Biosciences. J.G.T.Z. owns stocks in the biotechnology exchange-traded funds CNCR, IDNA, IBB and XBI, owns stock in Novo Nordisk and owns stock in Adaptive Biotechnologies, 2seventy bio and bluebird bio. J.J-V. is a contractor at Genentech since 2021. M.S. is a contractor at Genentech since November 2020. O.R.-R. is a co-inventor on patent applications filed by the Broad Institute for inventions related to single-cell genomics. She has given numerous lectures on the subject of single-cell genomics to a wide variety of audiences and, in some cases, has received remuneration to cover time and costs. O.R.-R. is an employee of Genentech since 19 October 2020 and has equity in Roche. S.J.R. is a member of the SAB of Immunitas Therapeutics and receives research funding from Bristol Myers Squibb and Kite/Gilead. X.Z. is a co-founder of and consultant for Vizgen. The other authors declare no competing interests.

Figures

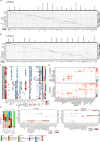
Fig. 1
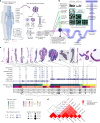
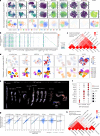
Fig. 1. Profiling of MBC biopsies using scRNA-seq, snRNA-seq and four spatial expression methods.
a, Schematic illustrating sample acquisition and data generation. Core biopsies dedicated to research were embedded in OCT or subjected to scRNA-seq. Per biopsy, one fresh or frozen core was used for scRNA-seq or snRNA-seq, respectively. For matching spatial profiling, a second, OCT-embedded core from the same biopsy procedure was cut in two sets of five 10-μm serial sections for processing with four spatial expression methods (Slide-seq, CODEX, MERFISH and ExSeq) and H&E staining. b, Schematic illustrating the properties of the different produced data types, the data processing framework and the performed analysis. c, Overview statistics of the produced scRNA-seq, snRNA-seq and spatial expression data as well as exemplary H&E images for the core biopsies used in spatial profiling. Biopsy site and receptor status for each of the profiled cores is indicated as well as the number of profiled observations (cells, beads or bins) and the number of detected features (RNA species or proteins). The number of replicates for each spatial expression method and biopsy is indicated in the respective blobs. HR, hormone receptor (ESR1 and PGR). Biopsies from the same patient are indicated with bold font and connected through lines. d, Clustered heatmap depicting the pair-wise Spearman correlation of methods based on sample-wise pseudobulk expression.
Fig. 2
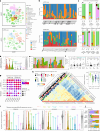
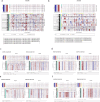
Fig. 2. Cell type composition and expression variance in snRNA-seq and scRNA-seq data.
a, UMAP representation of snRNA-seq and scRNA-seq data, colored by cell type. b, Stacked bar plots showing the cellular compartment composition for each sample in the snRNA-seq and scRNA-seq data. Samples that come from the same patient are highlighted in bold. c, Stacked bar plots showing the cell type composition for pairs of samples from the same patient. sc, scRNA-seq; sn, snRNA-seq. d, Violin and box plots representing the percent variance in cell type frequency explained by the indicated variable for each of the 26 annotated cell types (e). n = 26 cell types; tx, treatment. e, Stacked bar plots showing the percent variance in cell type frequency explained by the indicated variables for each of the 26 annotated cell types. f, Box plots with overlaid data points (=samples), representing the normalized macrophage frequency (Pearson’s contingency ratio) stratified by different properties of the two variables that explain variance in macrophage frequency (e). The significance of differences in ‘one against all others’ comparisons (two-sided Wilcoxon test, Benjamini–Hochberg correction) is indicated. n indicates the number of biopsy samples. g, Dot plots depicting the expression level (mean expression) and frequency (fraction of expressing cells) of malignant marker genes as well as disease-relevant BC biomarkers across malignant cells, grouped by =profiling method and receptor status. h, Clustered heatmap of pair-wise correlations between pairs of pseudobulk expression profiles representing each sample’s malignant cell population, corrected for profiling method using ComBat (Methods). Inset: box plots overlaid with individual data points (=sample combinations as in the heatmap) showing the pair-wise Pearson correlation across samples within PAM50 groups. The significance of differences between the basal and all other groups (two-sided Wilcoxon test) is indicated. i, Violin and box plots representing for all genes the percent variance in normalized expression levels across sample-wise and compartment-wise pseudobulk profiles, explained by the indicated variable. The top 3–5 genes are indicated. n = 26,539 genes. j, Stacked bar plots showing the percent variance in normalized expression levels across sample- and compartment-wise pseudobulk profiles, explained by the indicated variables from i for the three receptor status defining genes, ESR1, PGR and ERBB2.
Fig. 3
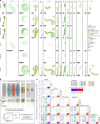
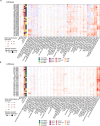
Fig. 3. Spatial expression profiling of MBC biopsies.
a, Overview of all spatial expression datasets covering all samples and methods included in this study. For each successful sample–method combination, a spatial scatter plot is shown where each observation (cell, bead and bin) is displayed and colored by its OT annotated cell type. Data for the same biopsy are spatially aligned and depicted at the same scale. A more detailed view of individual samples for which data are available from all spatial profiling methods is provided in Supplementary Figs. 1–5. b, Schematic illustrating the comparison by Pearson correlation of high-resolution cell type composition within spatially corresponding 100 × 100-μm bins across methods, within biopsies. An example for one bin (white star) within one biopsy is shown. c, Box plots displaying the correlations between cell type compositions within spatially corresponding 100 × 100-μm bins as measured by the indicated pairs of methods, displayed individually per biopsy. Correlations within the same method were calculated when technical replicates were available. The mean Pearson correlation for each pair of methods is indicated by the color-scaled inset. n indicates the number of 100 × 100-μm bins.
Fig. 4
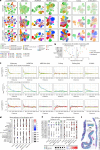
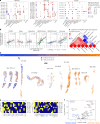
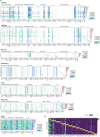
Fig. 4. Recovering spatial and molecular signals across spatial expression profiling methods.
a, UMAPs of all data across biopsies based on their expression profiles, generated with the indicated methods, with observations colored by TACCO-OT annotated cell type, patient/sample and Leiden clusters (resolution, 0.8). b, Error bar plot with mean ± s.d. showing the ARI quantifying cluster cohesion between Leiden clusters and patient/sample or cell type annotation across 10 bootstrapping iterations for each indicated method, as in a. ARI ranges between −1 and 1, where 1 indicates perfect agreement, 0 indicates a random agreement and −1 indicates completely different groupings. n = 10 bootstrapping iterations. c, Line plots depicting co-localization strength (y axis) of macrophages with all other measured cell types in dependence of distance (x axis), derived from the indicated data types in the indicated three biopsies, selected to represent three spatial co-localization phenotypes (short-range accumulation, long-range accumulations and intermixing). The distance is measured in μm. d, Dot plot displaying aggregated (mean across samples) co-localization range (size) and strength (color) of macrophages with all other cell types per method. Co-localization strength values lower than 0 indicate exclusion/repulsion. e, Dot plot displaying co-localization range (size) and strength (color) of macrophages with other macrophages or malignant cells for all samples and methods. Co-localization strength values lower than 0 indicate exclusion/repulsion. f, Spatial scatter plot of macrophages overlaid onto H&E images showing the expression levels of CD163 in the depicted macrophages, for the three example biopsies representing the three co-occurrence cases as in c, based on cell-segmented MERFISH data.
Fig. 5
Fig. 5. Characterizing macrophage and malignant expression phenotypes across spatial expression profiling methods.
a, UMAPs of all observations confidently annotated as macrophages across biopsies based on their expression profiles, colored by log-normalized expression of CD163, log-normalized expression of HLA-DRA or Leiden clusters. b, Dot plot depicting the scaled expression (by gene, across clusters) and fraction of expressing cells of macrophage marker and function genes as well as marker genes for other cell types and differentially expressed genes between clusters as in a for cell-segmented MERFISH data. Side bar plots indicate the number of cells in each cluster. c, Clustered heatmap depicting the pair-wise Spearman correlation of methods based on sample-wise pseudobulk expression of macrophage marker and function genes as in b. d, UMAPs of all observations annotated as malignant cells across biopsies based on their expression profiles, colored by their EMT score expression (capped at −1 and 1 for comparability) or patient/sample. e, Spatial scatter plots of the cell-segmented MERFISH data where each cell is colored by its EMT score expression (capped at −1 and 1 for comparability). Samples are grouped into three spatial EMT phenotypes—EMT-high, EMT-low and EMT-patched—based on the distribution of the EMT signal across space. f, Dot plot depicting the differential expression significance (two-sided Welch’s t-test, Benjamini–Hochberg correction) of genes overexpressed in one of the three spatial EMT phenotypes (EMT-high, EMT-low and EMT-patched), as detected in the cell-segmented MERFISH data (e). g, Scatter plot relating the log fold changes of gene expression between EMT-high and EMT-patched samples as detected in cell-segmented MERFISH to the corresponding expression changes detected in the other indicated methods. The significance of differential expression was calculated by a two-sided Welch’s t-test and Benjamini–Hochberg correction. The Spearman correlation is indicated. Error bands indicate standard error. h, Clustered heatmap depicting the pair-wise Spearman correlation of methods based on gene-wise log fold changes between EMT-high and EMT-patched samples, defined as in e and related to g. FC, fold change; man, manual.
Fig. 6
Fig. 6. Characterizing the cellular neighborhoods of malignant expression phenotypes across spatial expression profiling methods.
a, Dot plots depicting the log fold change (color) and significance (size) of differences in cell type frequencies between EMT-high and EMT-low neighborhoods (100 × 100-μm bins) within each section for MERFISH, Slide-seq and CODEX. ExSeq data did not yield any significant results. Replicates (serial sections) of the same biopsy are denoted with ‘_1–3’. P values were calculated using a two-sided Wilcoxon test and Benjamini–Hochberg multiple testing correction. b, Scatter plot relating the log fold changes of cell type frequency between EMT-high and EMT-low neighborhoods within samples as detected in cell-segmented MERFISH to the corresponding cell type frequency changes detected in the other indicated methods. The significance of differential cell type frequencies was calculated by a two-sided Wilcoxon test and Benjamini–Hochberg correction. The Spearman correlation is indicated; error bands indicate standard error. c, Clustered heatmap depicting the pair-wise Spearman correlation of methods based on cell type frequency log fold changes between EMT-high and EMT-low neighborhoods within samples, defined as in Fig. 5e, related to b. d, Spatial scatter plots of the malignant cells within the cell-segmented MERFISH data where each cell is colored as to whether or not it resides in the same 100 × 100-μm bin as at least one T/NK cell. e, Clustered binary heatmaps of whether or not a gene is among the top 10 differentially expressed genes between malignant cells residing close to a T/NK cell and those that do not within each biopsy, measured by cell-segmented MERFISH. Only genes that occur in at least two samples are shown. Genes are colored by their directionality in the common differential expression analysis. Genes with different directionality between patient-specific and combined analysis show discordant coloring. f, Volcano plot of differential gene expression analysis (two-sided Wilcoxon test, Benjamini–Hochberg correction) between malignant cells residing close to a T/NK cell and those that do not across all biopsies, measured by cell-segmented MERFISH data. Genes are colored by their directionality in the sample-specific differential expression analysis. Genes with different directionality between patient-specific and combined analysis show discordant coloring. FC, fold change; man, manual.
Extended Data Fig. 1
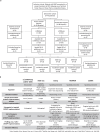
Extended Data Fig. 1. Overview of biopsy sample handling and profiling methods.
a) Flow diagram outlining biopsy enrollment and allocation. b) Table outlining the key characteristics and design parameters of the profiling methods employed in this study.
Extended Data Fig. 2
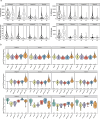
Extended Data Fig. 2. Quality statistics overview for sc/snRNA-Seq and spatial methods.
a) Box- and violin plots depicting the distribution of the indicated quality measures for snRNA-Seq and scRNA-Seq data, stratified by cell type compartment (malignant, stromal, lymphoid, myeloid). N indicates cells or biopsy samples according to the axis labels. b) Box- and violin plots depicting the distribution of the indicated quality measures for the indicated spatial methods, stratified by cell type compartment (malignant, stromal, lymphoid, myeloid). N indicates observations (cells, beads, or bins) or tissue sections according to the axis labels.
Extended Data Fig. 3
Extended Data Fig. 3. Cell type characterization of the sc/snRNA-Seq data.
a, b) Stacked violin plots depicting the expression of the top 5 cell type marker genes for each of the indicated cell types, detected by 1 vs. all differential expression analysis for the snRNA-Seq data (panel a) and scRNA-Seq data (panel b). c) Heat map depicting the number of cells of each cell type detected in each of the samples. The color scale corresponds to the indicated respective number of cells. d) Dot plots depicting the expression level (mean expression) and frequency (fraction of expressing cells) of the indicated previously published cell subtype signatures across cells of the annotated broader cell types. e) Stacked barplot showing the cell type composition for biopsies of bone and brain metastasis. f) Dot plots depicting the expression of genes reported to be implicated in bone metastasis (Che.: Chen2017, Kang2003, Jo.:Jones2006, G.:Guise1996, W.:Westbrook2018, Joh.:Johnson2016) across cell types and metastatic sites covered in the snRNA-Seq (left) and scRNA-Seq (right) dataset, respectively.
Extended Data Fig. 4
Extended Data Fig. 4. Copy number aberration (CNA) detected in the sc/snRNA-Seq data.
a,b) CNA heatmaps across malignant cells, grouped by sample, for snRNA-Seq data (panel a) and scRNA-Seqdata (panel b) c) CNA heatmaps for both samples from patient 223. Samples were taken from different liver lesions, 300 days apart and processed with snRNA-Seq. d) CNA heatmaps for both samples from patient 262. Samples were taken from the same liver lesion at the same time but processed with snRNA-Seq and scRNA-Seq respectively. e) CNA heatmaps for both samples from patient 862. Samples were taken from the same breast lesion but 220 days apart, and processed with snRNA-Seq. f) CNA heatmaps for both samples from patient 887. Samples were taken from the same axilla lesion but 200 days apart, and processed with snRNA-Seq.
Extended Data Fig. 5
Extended Data Fig. 5. Expression of malignant hallmark signatures in the malignant sc/snRNA-Seq data.
a, b) Dot plots depicting the expression level (mean expression) and variability (standard deviation) of the indicated hallmark gene sets in MSigDB, across the malignant cells in each of the indicated samples, separately for snRNA-Seq (panel a) and scRNA-Seq data (panel b).
Extended Data Fig. 6
Extended Data Fig. 6. Malignant expression programs as identified by iNMF.
a) Clustered heatmap of pairwise correlations across all 20 malignant expression programs, represented by relative gene importance, detected by iNMF in the snRNA-Seq data (frozen) and scRNA-Seq data (fresh), each.
Extended Data Fig. 7
Extended Data Fig. 7. Integration of snRNA-Seq and scRNA-Seq data in low-dimensional space.
a) UMAPs depicting all observations from the sc/snRNA-Seq data based on their unaligned, BBKNN integrated, or Harmony integrated, dimensionality-reduced transcriptomes. Colored by method, Leiden clusters (resolution: 0.4), samples, and cell types. Samples from the same patient are marked.
Extended Data Fig. 8
Extended Data Fig. 8. Correspondence of cell type composition across profiling methods and annotations.
a) Boxplots depicting the correlation of cell type composition between sc/snRNA-Seq and spatial methods, for each biopsy, stratified by annotation method (TACCO-OT or RCTD). The individual data points are overlaid. N indicates number of sample-pairs. b) Spatial scatter plots displaying the correlation between cell type compositions within 100×100 μm bins as measured by the indicated pairs of methods in the 514-6760 biopsy. c) Boxplots depicting the correlation of cell type composition between sc/snRNA-Seq and spatial methods, for each biopsy, stratified by single-cell profiling method (snRNA-Seq or sc RNAseq). The individual data points are overlaid. d) Heatmap depicting for the segmented MERFISH data, the congruence of cell type annotations based on manual cluster analysis/marker expression (de-novo) and automated sn/scRNA-Seq-based annotation by TACCO-OT or RCTD, respectively. Numbers indicate the number of cells with the respective annotation combination. e) UMAPs of all cell-segmented MERFISH data based on their expression profiles, with observations colored by cell type as annotated based on cluster analysis/marker expression (de-novo), or annotation transfer from sc/snRNA-Seq using TACCO-OT or RCTD respectively.
Extended Data Fig. 9
Extended Data Fig. 9. Characterization of macrophage subsets based on expression states across methods.
a) Spatial scatter plot overlaid onto H&E images depicting the expression levels of CD163 in macrophages for all biopsies, based on cell-segmented MERFISH data. b) UMAPs of all observations confidently annotated as macrophages across biopsies based on their unaligned or harmony sample-integrated expression profiles, colored by sample/patient or Leiden clusters (resolution: 0.6). c) Clustered heatmap depicting the pairwise Pearson correlation of scaled Leiden cluster-wise expression profiles across methods. Method and cluster ID (as in panel b) are indicated. d) Boxplots depicting the expression of macrophage marker and function genes in the method-specific macrophage clusters grouped in cross-method cluster 1 (N = 15) and 2 (N = 20) according to panel c). Genes are ordered by the median difference between cross-method cluster 1 and 2. N = method-specific clusters.
Extended Data Fig. 10
Extended Data Fig. 10. Macrophage subset marker gene expression.
a) Dot plots depicting the scaled expression (by gene, across clusters) and fraction of expressing cells of macrophage marker and function genes as well as marker genes for other cell types and differentially expressed genes between clusters as in Extended Data Fig. 9b for all methods as indicated. Side-barplots indicate the number of cells in each cluster. b) Heatmap of scaled (across clusters) gene expression showing the top up to five differentially expressed genes (FDR < 0.05, log-fold change > 1.5) between the indicated cell-segmented MERFISH clusters.

Similar articles

References

    1. Egeblad, M., Nakasone, E. S. & Werb, Z. Tumors as organs: complex tissues that interface with the entire organism. Dev. Cell18, 884–901 (2010). - PMC - PubMed
    1. Fridman, W. H., Zitvogel, L., Sautès-Fridman, C. & Kroemer, G. The immune contexture in cancer prognosis and treatment. Nat. Rev. Clin. Oncol.14, 717–734 (2017). - PubMed
    1. El Bairi, K. et al. The tale of TILs in breast cancer: a report from The International Immuno-Oncology Biomarker Working Group. NPJ Breast Cancer7, 150 (2021). - PMC - PubMed
    1. Rao, A., Barkley, D., França, G. S. & Yanai, I. Exploring tissue architecture using spatial transcriptomics. Nature596, 211–220 (2021). - PMC - PubMed
    1. Moses, L. & Pachter, L. Museum of spatial transcriptomics. Nat. Methods19, 534–546 (2022). - PubMed

LinkOut - more resources