. 2023 May 30;42(5):112511.
doi: 10.1016/j.celrep.2023.112511. Epub 2023 May 16.

Single-cell transcriptomics of human-skin-equivalent organoids

Affiliations

Single-cell transcriptomics of human-skin-equivalent organoids

Adam R Stabell et al. Cell Rep. .

Abstract

Several methods for generating human-skin-equivalent (HSE) organoid cultures are in use to study skin biology; however, few studies thoroughly characterize these systems. To fill this gap, we use single-cell transcriptomics to compare in vitro HSEs, xenograft HSEs, and in vivo epidermis. By combining differential gene expression, pseudotime analyses, and spatial localization, we reconstruct HSE keratinocyte differentiation trajectories that recapitulate known in vivo epidermal differentiation pathways and show that HSEs contain major in vivo cellular states. However, HSEs also develop unique keratinocyte states, an expanded basal stem cell program, and disrupted terminal differentiation. Cell-cell communication modeling shows aberrant epithelial-to-mesenchymal transition (EMT)-associated signaling pathways that alter upon epidermal growth factor (EGF) supplementation. Last, xenograft HSEs at early time points post transplantation significantly rescue many in vitro deficits while undergoing a hypoxic response that drives an alternative differentiation lineage. This study highlights the strengths and limitations of organoid cultures and identifies areas for potential innovation.

Keywords: CP: Stem cell research; differentiation; human epidermis; hypoxia; organoid; single-cell RNA sequencing.


Conflict of interest statement

Declaration of interests The authors declare no competing interests.

Figures
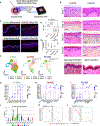
Figure 1.
Figure 1.. Defining HSE cell populations using scRNA-seq
(A) Diagram of the human-skin-equivalent (HSE) organoid culture setup. (B) Hematoxylin and eosin (H&E) staining of Matrigel-grown HSEs (GelHSEs) and fibroblast-seeded HSEs (FibHSEs) after 7, 14, 21, and 28 days of growth on devitalized human dermis. Neonatal epidermis from foreskin and adult epidermis from the leg are shown for comparison. Scale bars, 100 μm. Dashed lines denote the epidermal-dermal junction. (C) Immunostaining of KI67 (red) and DAPI (blue) in human neonatal skin (top left), adult abdominal skin (bottom left), day 28 GelHSEs (top right), and day 28 FibHSEs (bottom right). Scale bars, 100 μm. Dashed lines denote the epidermal-dermal junction. (D and E) Quantification of (D) KI67+ cells and (E) average thickness of living epidermal cell layers in human neonatal skin, adult abdominal skin, day 28 GelHSEs, and day 28 FibHSEs. n = 3 each sample. Significance was determined by Tukey’s HSD (honestly signifiant difference) test. *p < 0.05. n.s., not significant. Error bars represent the standard error of the mean (SEM). (F) Seurat clustering of 15,573 single cells isolated from four HSE libraries (two GelHSEs and two FibHSEs) and two in vivo neonatal epidermis libraries using uniform manifold approximation and projection (UMAP) embedding. Libraries are split by sample type. Dashed lines encompass HSE-unique keratinocytes. (G–I) Dot plots of the top differentially expressed marker genes for (G) in vivo clusters, (H) GelHSE clusters, and (I) FibHSE clusters. (J–L) Percentage of total cells within each cluster split by sample type (J). A Monte Carlo permutation test shows the significance of the changes in proportion of each cell type for the FibHSEs (K) and GelHSEs (L) relative to the in vivo datasets. Bars represent 95% confidence interval determined via bootstrapping.
Figure 2.
Figure 2.. HSEs display altered expression patterns and lineage paths
(A–D) Immunostaining of (A) the terminal differentiation markers FLG and LOR, (B) the structural proteins DSG1 and COL17A1, (C) the BAS stem cell markers KRT15 and KRT19, and (D) the HSE-unique markers PSCA and VIM. Shown are human neonatal skin (top), day 28 GelHSEs (center), and day 28 FibHSEs (bottom). Feature plots (right) show RNA expression of the indicated markers for each sample type. Scale bars, 100 μm. Dashed lines denote the epidermal-dermal junction. (E) Pseudotime inference of epidermal keratinocytes from the integrated datasets. (F) Cell lineage diagram of keratinocytes from the integrated datasets. Edge weights denote the probability of transition to each cluster. Dot size denotes number of cells. (G) Splicing kinetics depicted as RNA velocity streams calculated using the Python package scVelo. (H) Quantification of Cellular Entropy (ξ) using the R package SoptSC.
Figure 3.
Figure 3.. HSEs possess an EMT-like gene expression signature driven by EGF signaling
(A) Cell-cell communication networks predicted for the EGF signaling pathway inferred using the R package CellChat. Edge weights represent the probability of signaling between cell clusters. (B) Relative contributions of each ligand, receptor, and cofactor group to the cell-cell communication predicted in (A). (C) Feature plots showing the expression patterns of EGFR and each of the ligands contributing to the EGF signaling network. (D) Violin plots of relative gene expression for positive markers (VIM, LAMC2, and LGALS1) and negative markers (CDH1) of EMT. (E) Visualization of signaling probability scores of ligand-receptor/co-receptor pairs involving LAMC2 for GelHSE and FibHSE datasets. In vivo datasets had no imputed signaling interactions involving LAMC2. Dot size represents p value. (F) Feature plots (top) and violin plots (bottom) showing the relative EMT gene score for each cell and cluster, separated by sample type. (G) Immunostaining of SLUG in the FibHSE, GelHSE, and in vivo samples. Scale bar, 100 μm. (H) Immunostaining of VIM in FibHSEs supplemented with the indicated concentrations of EGF. Quantification of VIM staining intensity is shown on the right. n = 3 each condition. One-tailed Student’s t test was used to determine significance. *p < 0.1. Scale bar, 100 μm.
Figure 4.
Figure 4.. Xenografting rescues terminal differentiation, cell-cell adhesion, and organoid-specific programs
(A) Schematic of the strategy to xenograft HSE tissue. (B) H&E staining of xenograft tissue. Scale bars, 100 μm. Dashed lines denote the epidermal-dermal junction. (C) Seurat clustering of single cells isolated from pooled xenograft libraries (n = 3 samples pooled prior to sequencing) and two neonatal epidermal libraries and displayed using UMAP embedding. Libraries are split by sample type. Dashed lines encompass xenograft-unique clusters. (D) Percentage of total cells within each cluster split by sample type. (E) Monte Carlo permutation test showing the significance of the changes in proportion of each cell type for the xenograft relative to the in vivo datasets. Bars represent 95% confidence interval determined via bootstrapping. (F) Pearson correlation of average RNA expression of each cluster compared with all other clusters between the in vivo datasets (left) and between the xenograft dataset and both in vivo datasets (right). (G) Immunostaining of the indicated markers in HSE xenografted tissue. Feature plots show RNA expression of the indicated markers on the right. Scale bars, 100 μm. Dashed lines denote the epidermal-dermal junction.
Figure 5.
Figure 5.. Hypoxia-driven transcriptional changes are observed in xenografts
(A and B) Pseudotime inference (A) and cell lineage diagram (B) of epidermal keratinocytes from the integrated in vivo and xenograft datasets. Edge weights denote the probability of transition to each cluster. Dot size denotes number of cells. (C) Quantification of ξ using the R package SoptSC. (D) Feature plots showing SBSN and COL17A1, marking differentiated and undifferentiated keratinocytes, respectively. (E) Splicing kinetics depicted as RNA velocity streams calculated using the Python package scVelo. (F and G) Significant cell-cell communication networks inferred using the R package CellChat. (H) Metaclustering of xenograft cells into xenograft-unique and non-unique cohorts. (I) Heatmap showing the top 200 differentially expressed genes (DEGs) between the two metaclusters. The x axis represent cells from the xenograft dataset, and the y axis represents DEGs. Yellow represents relatively higher expression, while purple represents relatively low expression. (J) Gene Ontology (GO) analysis of the top DEGs shown in (I). Blue bars indicate biological processes upregulated in xenograft-unique cells; red bars indicate biological process downregulated in xenograft-unique cells. (K) Feature plots showing expression of a hypoxia gene module consisting of 34 hypoxia-related genes. (L) Immunostaining of HIF1-α in human neonatal epidermis and xenograft tissue. Quantification of the nuclear HIF1-α stain is shown on the right. Significance was determined by unpaired two-tailed t test. *p < 0.001. Error bars represent standard error of the mean (SEM). (M) Immunostaining for KRT15 (left), KRT10 (center), and LOR (right). Pseudocoloring represents fluorescence intensity. Scale bars, 100 μm.

Similar articles

Cited by

References

    1. Kolarsick PAJ, Kolarsick MA, and Goodwin C. (2011). Anatomy and physiology of the skin. J. Dermatol. Nurses Assoc 3, 203–213. 10.1097/JDN.0b013e3182274a98. - DOI
    1. Ghazizadeh S, and Taichman LB (2005). Organization of stem cells and their progeny in human epidermis. J. Invest. Dermatol 124, 367–372. 10.1111/j.0022-202X.2004.23599.x. - DOI - PMC - PubMed
    1. Khavkin J, and Ellis DAF (2011). Aging skin: histology, physiology, and pathology. Facial Plast. Surg. Clin. North Am 19, 229–234. 10.1016/j.fsc.2011.04.003. - DOI - PubMed
    1. Corrò C, Novellasdemunt L, and Li VSW (2020). A brief history of organoids. Am. J. Physiol. Cell Physiol 319, C151–C165. 10.1152/ajpcell.00120.2020. - DOI - PMC - PubMed
    1. Zomer HD, and Trentin AG (2018). Skin wound healing in humans and mice: challenges in translational research. J. Dermatol. Sci 90, 3–12. 10.1016/j.jdermsci.2017.12.009. - DOI - PubMed

Publication types