. 2023 Apr 28;380(6643):eabn2937.
doi: 10.1126/science.abn2937. Epub 2023 Apr 28.

Leveraging base-pair mammalian constraint to understand genetic variation and human disease

Collaborators, Affiliations

Leveraging base-pair mammalian constraint to understand genetic variation and human disease

Patrick F Sullivan et al. Science. .

Abstract

Thousands of genomic regions have been associated with heritable human diseases, but attempts to elucidate biological mechanisms are impeded by an inability to discern which genomic positions are functionally important. Evolutionary constraint is a powerful predictor of function, agnostic to cell type or disease mechanism. Single-base phyloP scores from 240 mammals identified 3.3% of the human genome as significantly constrained and likely functional. We compared phyloP scores to genome annotation, association studies, copy-number variation, clinical genetics findings, and cancer data. Constrained positions are enriched for variants that explain common disease heritability more than other functional annotations. Our results improve variant annotation but also highlight that the regulatory landscape of the human genome still needs to be further explored and linked to disease.


Conflict of interest statement

Competing interests: P.F.S. is a consultant and shareholder for Neumora.

Figures

Fig. 1.
Fig. 1.. Overview of constraint distribution.
(A) Evolutionary constraint in multiple genomic partitions. The x axis is the fraction of the genome occupied by a partition, the y axis is the fraction of partition under constraint in placental mammals (purple circles) and primates (blue triangles), and the gray line is the genome mean (0.033). The greatest constraint is found in CDS and key regulatory regions (5′UTRs, ENCODE promoter-like elements, and 3′UTRs). The higher fraction constrained in primates versus mammals is due to different constraint definitions and does not necessarily reflect biology. This figure is a subset of fig. S1 and data from section 4 of the SM, which shows more biotypes, PC gene parts, and regulatory regions. dhs, DNase I hypersensitive sites. (B) Whisker plots of constraint in variants from TOPMed whole-genome sequencing (WGS), stratified by CDS (green, 6.14 million biallelic SNPs) and non-CDS variants (orange, 549.64 million biallelic SNPs). The x axis shows six AC bins, from singletons (bin AC = 1, 44.8% of total variants) to common and low-frequency variants (AF ≥ 0.5%, 1.4% of total variants). For the plots, the center line represents the median, box limits are upper and lower quartiles, and whiskers are minimum and maximum values. Outliers are hidden for clarity. (C) PhyloP score density for ClinVar benign (N = 231,642), ClinVar pathogenic (N = 73,885), and gnomAD WGS variant positions with CADD ≥ 20 (N = 3,958,488).
Fig. 2.
Fig. 2.. SNP-h2 analyses of variants at constrained positions in human complex traits and diseases.
(A) Heritability enrichment of common SNPs in the top percentiles of constraint scores in placental mammals (phyloP positions) and primates (phastCons elements). (B) Heritability enrichment as a function of the distance to a constrained base. (C) Heritability enrichment of constrained annotations in 11 blood and immune traits and nine brain diseases (light color) versus other types of traits (dark color). *P < 0.05 and **P < 0.05 after Bonferroni correction. (D) Heritability enrichment of constrained and functional annotations (left) and corresponding significance of the conditional effect while considered in a joint model with 106 annotations (right). GERP, genomic evolutionary rate profiling. (E) Heritability enrichment of constrained annotations intersected together and stratified by their genomic function. (F) Squared transancestry genetic correlation enrichment (left) with corresponding significance (right) for seven annotations with significant depletion of squared transancestry genetic correlations. H3K27ac, histone H3 acetylated at lysine 27. (G) Standardized squared effect sizes as a function of AF. Results are meta-analyzed across, 63 independent GWASs [(A), (B), (D), and (E)], 31 independent traits with GWASs available in European and Japanese populations [(F)], and 27 independent UK Biobank traits [(G)]. Dashed red lines represent a null enrichment of 1 [(A) to (E)] and a null squared transancestry genetic correlation (F). Error bars are 95% confidence intervals. Numerical results are reported in data S2 to S4, S6 to S8, and S11.
Fig. 3.
Fig. 3.. Leveraging constraint to move from variation to function.
(A and B) We report the cumulative distribution function (CDF) of PIP scores using functionally informed fine-mapping with different models of functional annotations. Distribution functions are split into subpanels according to whether the fine-mapped SNP overlaps high constraint scores in mammals (A) and primates (B). One-way Kolmogorov-Smirnov tests show that CDFs for PIP scores obtained from the baseline-LF model (blue) are lower (above) than the CDFs for PIP scores obtained from the baseline-LF+Zoonomia model (orange) with Bonferroni correction for N = 4 categories across panels (***P < 0.0001; NS is not significant). (C and D) Examples of constrained fine-mapped variants. We report GWAS P values (top) and corresponding PIP scores under different functionally informed fine-mapping models (bottom). The shapes of the data points correspond to constraint information. (E) Fine-mapped variants are not limited to the annotated genome, as exemplified by rs72782676 (red dot in the AF panel) in the GATA3 UNICORN locus. TFBS, transcription factor binding site; cCREs, candidate cis-regulatory regions. (F and G) Constraint is formally linked to function through MPRAs at the regional oligo (F) and base-pair (G) level for neutral, active, and allele-specific skewed effects. (H) For the LDLR promoter locus, the MPRA effect is strongly correlated with the phyloP score. Constrained (red) and unconstrained (orange) ClinVar pathogenic variants are plotted to highlight known deleterious positions. In (E) and (H), the dashed orange lines represent the 5% FDR threshold for constraint.
Fig. 4.
Fig. 4.. Evolutionary constraint, PC genes, and human disease.
(A) Scatterplot of PC gene clustering [uniform manifold approximation and projection (UMAP) and density-based spatial clustering of applications with noise (DBSCAN)]. The x and y axes are the UMAP coordinates. Each point is a PC gene (N = 19,386). Five clusters are labeled: (a) 56 genes whose CDS bases are in complex regions that align poorly; (b) 221 genes that are apparently human- or primate-specific; (c) 669 genes with good alignment and possible human-specific functions [e.g., five human leukocyte antigen (HLA) genes and 14 interferon-α genes]; (d) 15 genes, all highly constrained; and (e) all other 18,425 PC genes. Coloring shows fracCdsCons, where gray indicates least and red indicates most constrained with an anticlockwise gradient in mammalian constraint from the upper middle to lower right. (B and C) Gene constraint deciles versus external gene sets as “lollipop plots” Zoonomia fracCdsCons are shown in (B). A recapitulation of figure 3 from (3) with the LOEUF decile reversed and missing data shown is presented in (C). Each panel has six subgraphs for autosomal-recessive genes, ClinGen level 3 genes, essential genes from Hart, essential genes in mouse, olfactory receptor genes, and severe haploinsufficiency genes. The x axis is the constraint decile (0 is least, 9 is most constrained, 99 is missing). The y axis is the fraction of the PC genes in a gene set in each decile as represented by circles. (D) Gene heritability enrichment for SNPs linked to genes of each decile of fracCdsCons. The dashed red line represents a null enrichment of 1. Error bars are 95% confidence intervals. (E) Spearman’s correlation of the constraint fraction between the parts of PC genes. (F and G) Fraction of CDS constraint (fracCdsCons) versus fraction of promoter constraint (F) and fraction of distal enhancer constraint (G) (shrunk to values <0.3). For (F) and (G), each point is a PC gene, and HOX genes (purple) and DEFB genes (green) are highlighted. (H) Gene heritability enrichment for SNPs linked to genes of decile of constraint in different gene features, plotted as per (D).
Fig. 5.
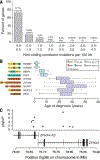
Fig. 5.. Cancer driver genes identified using NCCM rates.
(A) Distribution of the rates of NCCM for medulloblastoma. (B) An example set of the candidate driver genes found either in pediatric (light blue) or adult (purple) samples. Age of diagnosis (years) of the patient is indicated together with the tumor subgroup. (C) The ZFHX4 locus contains nine NCCMs drawn from eight patients.

Update of

Similar articles

Cited by

  • The shared genetic architecture and evolution of human language and musical rhythm.
    Alagöz G, Eising E, Mekki Y, Bignardi G, Fontanillas P; 23andMe Research Team; Nivard MG, Luciano M, Cox NJ, Fisher SE, Gordon RL. Alagöz G, et al. Nat Hum Behav. 2024 Nov 21. doi: 10.1038/s41562-024-02051-y. Online ahead of print. Nat Hum Behav. 2024. PMID: 39572686
  • Genome-wide copy number variation association study in anorexia nervosa.
    Walker A, Karlsson R, Szatkiewicz JP, Thornton LM, Yilmaz Z, Leppä VM, Savva A, Lin T, Sidorenko J, McRae A, Kirov G, Davies HL, Fundín BT, Chawner SJRA, Song J, Borg S, Wen J, Watson HJ, Munn-Chernoff MA, Baker JH, Gordon S, Berrettini WH, Brandt H, Crawford S, Halmi KA, Kaplan AS, Kaye WH, Mitchell J, Strober M, Woodside DB, Pedersen NL, Parker R, Jordan J, Kennedy MA, Birgegård A, Landén M, Martin NG, Sullivan PF, Bulik CM, Wray NR. Walker A, et al. Mol Psychiatry. 2024 Nov 12. doi: 10.1038/s41380-024-02811-2. Online ahead of print. Mol Psychiatry. 2024. PMID: 39533101
  • Rare variant contribution to the heritability of coronary artery disease.
    Rocheleau G, Clarke SL, Auguste G, Hasbani NR, Morrison AC, Heath AS, Bielak LF, Iyer KR, Young EP, Stitziel NO, Jun G, Laurie C, Broome JG, Khan AT, Arnett DK, Becker LC, Bis JC, Boerwinkle E, Bowden DW, Carson AP, Ellinor PT, Fornage M, Franceschini N, Freedman BI, Heard-Costa NL, Hou L, Chen YI, Kenny EE, Kooperberg C, Kral BG, Loos RJF, Lutz SM, Manson JE, Martin LW, Mitchell BD, Nassir R, Palmer ND, Post WS, Preuss MH, Psaty BM, Raffield LM, Regan EA, Rich SS, Smith JA, Taylor KD, Yanek LR, Young KA; NHLBI Trans-Omics for Precision Medicine (TOPMed) Consortium; Hilliard AT, Tcheandjieu C, Peyser PA, Vasan RS, Rotter JI, Miller CL, Assimes TL, de Vries PS, Do R. Rocheleau G, et al. Nat Commun. 2024 Oct 9;15(1):8741. doi: 10.1038/s41467-024-52939-6. Nat Commun. 2024. PMID: 39384761 Free PMC article.
  • Unifying approaches from statistical genetics and phylogenetics for mapping phenotypes in structured populations.
    Schraiber JG, Edge MD, Pennell M. Schraiber JG, et al. PLoS Biol. 2024 Oct 9;22(10):e3002847. doi: 10.1371/journal.pbio.3002847. eCollection 2024 Oct. PLoS Biol. 2024. PMID: 39383205 Free PMC article.
  • Comparative Population Genomics of Arctic Sled Dogs Reveals a Deep and Complex History.
    Smith TA, Srikanth K, Huson HJ. Smith TA, et al. Genome Biol Evol. 2024 Sep 3;16(9):evae190. doi: 10.1093/gbe/evae190. Genome Biol Evol. 2024. PMID: 39193769 Free PMC article.

References

    1. Moore JE et al., Expanded encyclopaedias of DNA elements in the human and mouse genomes. Nature 583, 699–710 (2020). doi: 10.1038/s41586-020-2493-4 - DOI - PMC - PubMed
    1. Aguet F et al., The GTEx Consortium atlas of genetic regulatory effects across human tissues. Science 369, 1318–1330 (2020). doi: 10.1126/science.aaz1776 - DOI - PMC - PubMed
    1. Karczewski KJ et al., The mutational constraint spectrum quantified from variation in 141,456 humans. Nature 581, 434–443 (2020). doi: 10.1038/s41586-020-2308-7 - DOI - PMC - PubMed
    1. Taliun D et al., Sequencing of 53,831 diverse genomes from the NHLBI TOPMed Program. Nature 590, 290–299 (2021). doi: 10.1038/s41586-021-03205-y - DOI - PMC - PubMed
    1. Cooper GM, Shendure J, Needles in stacks of needles: Finding disease-causal variants in a wealth of genomic data. Nat. Rev. Genet. 12, 628–640 (2011). doi: 10.1038/nrg3046 - DOI - PubMed