. 2023 Apr 6;83(7):1180-1196.e8.
doi: 10.1016/j.molcel.2023.03.010.

Stress granules are shock absorbers that prevent excessive innate immune responses to dsRNA

Affiliations

Stress granules are shock absorbers that prevent excessive innate immune responses to dsRNA

Max Paget et al. Mol Cell. .

Abstract

Proper defense against microbial infection depends on the controlled activation of the immune system. This is particularly important for the RIG-I-like receptors (RLRs), which recognize viral dsRNA and initiate antiviral innate immune responses with the potential of triggering systemic inflammation and immunopathology. Here, we show that stress granules (SGs), molecular condensates that form in response to various stresses including viral dsRNA, play key roles in the controlled activation of RLR signaling. Without the SG nucleators G3BP1/2 and UBAP2L, dsRNA triggers excessive inflammation and immune-mediated apoptosis. In addition to exogenous dsRNA, host-derived dsRNA generated in response to ADAR1 deficiency is also controlled by SG biology. Intriguingly, SGs can function beyond immune control by suppressing viral replication independently of the RLR pathway. These observations thus highlight the multi-functional nature of SGs as cellular "shock absorbers" that converge on protecting cell homeostasis by dampening both toxic immune response and viral replication.

Keywords: ADAR1; RIG-I-like receptor; antiviral signaling; dsRNA; immune-mediated apoptosis; immunopathology; innate immunity; integrated stress response; molecular condensate; stress granule.


Conflict of interest statement

Declaration of interests B.t. is a cofounder of Archean Biologics. S.H. is a consultant for Odyssey therapeutics and CJ Cheil Jedang.

Figures
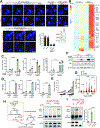
Figure 1.
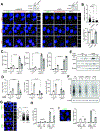
Figure 1.. RLR signaling is hyperactive in SG-deficient ΔG3BPs cells.
A. Immunofluorescence (IF) analysis of RIG-I, MAVS and dsRNA (red) with G3BP1 (green) in U2OS cells. See Figure S1A for antibody validation. Cells were transfected with 162 bp dsRNA containing 5’ppp (500 ng/ml) for 6 hrs prior to imaging. Raw images for RIG-I and MAVS without contrast adjustment (raw) were also shown. For dsRNA imaging, 162 bp dsRNA 3’-labeled with Cy5 was introduced into cells by lipofectamine transfection or electroporation. Unless mentioned otherwise, unlabeled dsRNA and lipofectamine transfection was used throughout the manuscript. Cell nuclei were stained with Hoechst 3342. Bottom right: SG colocalization was measured by Pearson colocalization coefficient (PCC) between G3BP1 foci and indicated molecules from 10 fields of view. B. Heatmap of z-scores displaying differentially expressed genes in WT vs ΔG3BPs U2OS cells. Cells were transfected with 162 bp dsRNA with 5’ppp (500 ng/ml) for 6 hrs. Genes showing log2-fold change (lfc2) >2 (with p_adj<0.05) upon dsRNA stimulation in a MAVS-dependent manner (based on the analysis in Figure S2B) were shown. All genes were shown in Figure S2A. C. Levels of IFNβ, IL-6, and RANTES mRNAs. U2OS cells were transfected with dsRNA as in (B) and were analyzed 6 or 24 hr post-dsRNA. Data were normalized to WT 6 hr post-dsRNA. D. Levels of secreted IFNβ, IL-6, and RANTES as measured by ELISA. U2OS cells were transfected with dsRNA as in (B) and were analyzed at 6 hr post-dsRNA. E. Level of IFNβ mRNAs in response to the increasing concentrations of dsRNA (50-2000 ng/ml) at 6 hr post-dsRNA. Data were normalized to WT 50 ng/ml. F. Activation state of IRF3, as measured by its phosphorylation level in U2OS cells. G. Activation state of IRF3, as measured by its nuclear translocation. U2OS cells were stained with anti-IRF3 antibody at indicated timepoints and the level of nuclear IRF3 signal was quantitated (a.u. indicates arbitrary unit). Each data point represents a nucleus (n=61-179). DAPI staining was used for defining nuclear boundary. H. Activation state of MAVS, as measured by cell-free IRF3 dimerization assay. Mitochondrial fraction (P5) containing MAVS was isolated from U2OS cells 6 hrs post-dsRNA, and mixed with a common pool of cytosolic extract (S18) from unstimulated WT U2OS cells and in vitro translated 35S-IRF3. Dimerization of 35S-IRF3 was analyzed by native gel assay. * indicates mini-MAVS. I. Cell-free IRF3 dimerization assay, comparing the activity of the mitochondrial fraction isolated from WT, ΔG3BPs and ΔG3BPs/ΔMAVS U2OS cells. Data are presented in means ± SD. p values were calculated using two-tailed unpaired Student’s t test (ns, p>0.05). RNA-seq results contain 2 biological repeats and were confirmed by two independent experiments. All other data are representative of at least three independent experiments.). Raw data for the heatmap can be found in the supplemental file (data 1).
Figure 2.
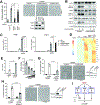
Figure 2.. SG deficiency leads to hyperactivation of RLR signaling.
A. Immunofluorescence analysis of RIG-I, MAVS, TIAR (red) and G3BP1 (green) in ΔUBAP2L and ΔPKR U2OS cells at 6 hrs post-dsRNA. B. G3BP1 foci size and frequency in ΔUBAP2L and ΔPKR U2OS cells. Foci size was quantitated for at least 200 randomly selected granules from Z-stack images (0.15 μm step size). Foci frequency was measured from 5 fields of view. C. Antiviral signaling in U2OS cells (WT vs ΔUBAP2L) in response to dsRNA transfection (500 ng/ml). Data were normalized to WT 6 hr post-dsRNA. D. Same as (C), comparing WT and ΔPKR U2OS cells. E. IRF3 phosphorylation in U2OS cells (WT vs ΔPKR) upon dsRNA stimulation. F. Level of protein synthesis as measured by puromycin incorporation (SUnSET assay). U2OS cells were transfected with dsRNA (500 ng/ml) for 6 hrs and pulsed with puromycin (1 μg/ml) for 15 mins prior to anti-puromycin WB. G. Colocalization of RIG-I, MAVS and TIAR (red) with G3BP1 (green) in U2OSΔPKR cells upon treatment with TG (1 μM) without dsRNA. G3BP1 foci size was quantitated for at least 600 randomly selected granules from Z-stack images (0.15 μm step size). H. Antiviral signaling in U2OS cells (WT vs ΔPKR) in response to dsRNA, in the presence and absence of TG. Cells were treated with TG (1 μM) at 1 hr post-dsRNA and harvested 6 hr post-dsRNA. Data were normalized to WT in the absence of TG. I. Antiviral signaling in U2OS cells (WT vs ΔPKR) in response to dsRNA, with or without nutrient starvation (N.S.). Cells were incubated with a starvation medium for 2 hrs prior to dsRNA transfection and were harvested 6 hr post-dsRNA. Data were normalized to WT in the absence of nutrient starvation. Left: SGs in ΔPKR cells upon nutrient starvation for 8 hrs as visualized by G3BP1 foci. Data are presented in means ± SD. p values were calculated using two-tailed unpaired Student’s t test (ns, p>0.05). Data are representative of three independent experiments.
Figure 3.
Figure 3.. SGs suppress PKR and OAS pathways.
A. Schematic of dsRNA-dependent innate immune pathways, involving the dsRNA sensors RLRs, PKR and OASes. B. IF analysis of PKR, OAS3, RNase L (red) and G3BP1 (green) in U2OS cells. See Figure S1A for antibody validation. C. SG colocalization was measured by Pearson colocalization coefficient (PCC) between G3BP1 foci and indicated molecules from 10 fields of view. D. PKR activity in WT vs. ΔG3BPs U2OS cells as measured by PKR phosphorylation and ATF4 expression at indicated time points. E. RNase L activity in WT vs. ΔG3BPs U2OS cells as measured by rRNA degradation. Total RNA was isolated 24 hr post-dsRNA and was analyzed by TapeStation.
Figure 4.
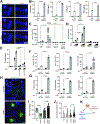
Figure 4.. SGs dampen dsRNA-triggered apoptosis and the consequent negative feedback regulation of IRF3.
A-C. Cell death in WT vs. ΔG3BPs U2OS cells at 24 hr post-dsRNA as examined by (A) bright-field microscopy, (B) caspase-3/7 activity and (C) Sytox uptake. D. Cell death in response to staurosporin (STS) and etoposide. U2OS cells were treated with STS (1 μM) or etoposide (20 μM) for 24 hrs before Sytox analysis. E. Cell death in WT, ΔUBAP2L and ΔPKR U2OS cells at 24 hr post-dsRNA. F. Comparison of cell death triggered by dsRNA, etoposide and a combination of caspase-8 inhibitor (Z-IETD-FMK, Casp-8i) and TNFα. Etoposide was used as a known trigger for apoptosis, while Casp-8i+TNFα was for necroptosis. G. Analysis of PARP and caspase-3 (Casp-3) cleavage using samples from (F). H. Apoptotic caspase cleavage in U2OS cells at 6 or 24 hr post-dsRNA. I. Effect of pan-caspase inhibitor (Q-VD-OPh) on dsRNA-triggered cell death, as measured by Sytox uptake at 24 hr post-dsRNA. U2OS cells were treated with Q-VD-OPh (10 μM) 1 hr pre-dsRNA. J. Effect of Q-VD-OPh (10 μM) on PARP cleavage in U2OSΔG3BPs cells at 24 hr post-dsRNA. K. Effect of Q-VD-OPh on IRF3 phosphorylation and caspase-3 cleavage. L. Effect of Q-VD-OPh on IFNβ mRNA induction in U2OSΔG3BPs cells. Data were normalized to 6 hr post-dsRNA in the absence of Q-VD-Oph. M. Effect of Q-VD-OPh on IFNβ mRNA induction in A549 cells. Data were normalized to 6 hr post-dsRNA in WT A549 in the absence of Q-VD-Oph. Data are presented in means ± SD. p values were calculated using two-tailed unpaired Student’s t test (ns, p>0.05). All data are representative of three independent experiments.
Figure 5.
Figure 5.. SGs prevent dsRNA-triggered cell death by suppressing RLR, PKR and OAS pathways.
A. Cell death in U2OS cells as measured by Sytox uptake (left) and bright field microscopy (right) at 24 hr post-dsRNA. B. Apoptotic caspase cleavage in Δ U2OS cells at 14 or 24 hr post-dsRNA. C. Levels of IFNβ and TNFα mRNAs in U2OS cells at 6 hr post-dsRNA. Data were normalized to WT at 6 hr post-dsRNA. D. Heat map of z-scores for differentially expressed genes in apoptosis pathway (KEGG pathway hsa04210) in U2OS cells at 6 hr post-dsRNA stimulation. E. Level of secreted TNFα in U2OS cells 6 hr post-dsRNA. F. Effect of anti-TNFα antibody on dsRNA-triggered cell death in U2OSΔG3BPs. Cells were pre-treated with anti-TNFα antibody (0.01, 0.1 and 1 μg/ml) 30 min prior to transfection with dsRNA. Cell death was measured by Sytox uptake at 24 hr post-dsRNA. G. Cell death in ΔG3BPs and ΔG3BPsΔPKR at 24 hr post-dsRNA. H. Cell death in ΔG3BPs and ΔG3BPsΔRNase L at 24 hr post-dsRNA. I. Schematic for dsRNA-induced cell death in ΔG3BPs cells. The lack of SGs make ΔG3BPs cells hypersensitive to dsRNA, resulting in more potent activation of RLR, PKR and OASes. The TNFα signaling branch (but not the IRF3-IFN branch) downstream of RLR-MAVS makes the primary contribution to cell death in U2OS cells. PKR and OASes-RNase L also contribute, likely by suppressing global protein synthesis. Data are presented in means ± SD. p values were calculated using two-tailed unpaired Student’s t test (ns, p>0.05). All data are representative of three independent experiments.
Figure 6.
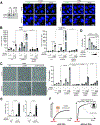
Figure 6.. SGs suppress RLR signaling during viral infection, while restricting viral replication independent of RLRs.
A. IF analysis of RIG-I, MAVS (red) and G3BP1 (green) in U2OS cells. Cells were infected with SeV (100 HA/ml) for 20 hrs. B. Levels of secreted IFNβ, IL-6, RANTES and TNFα as measured by ELISA. U2OS cells were infected with SeV (100 HA/ml) and were analyzed 6 hr post-infection (hpi). C. Antiviral signaling in U2OS cells upon SeV infection (MOI=1.0). Data were normalized to WT at 6 hpi. D. Cell death in U2OS cells at 24 hr post-SeV infection (MOI=0, 0.1, and 1.0). E. Effect of anti-TNF and Q-VD-Oph on cell death in U2OSΔG3BPs cells upon SeV infection. Cells were infected with SeV (MOI=0.1, and 1.0), treated with inhibitors 1 hpi and analyzed at 24 hpi. F. Antiviral signaling upon infection with IAVΔNS1, EMCV and VSVM51R. A549 cells were infected with IAVΔNS1 (MOI=0.1) and EMCV (MOI=0.1), whereas U2OS cells were infected with VSVM51R (MOI=1). Cells were harvested at 24 hpi for IAVΔNS1 and 6 hpi for EMCV and VSVM51R. Data were normalized to WT in the presence of virus for each graph. See also Figure S6 for more comprehensive analysis with different MOIs and time of analysis. G. Cell death upon infection with IAVΔNS1, EMCV and VSVM51R at 24 hpi. H. IF images of SeV proteins (green). U2OS cells were infected with SeV (MOI=1) and stained with anti-SeV serum at 18 hpi. I. Relative cell-to-cell spreading of SeV (MOI=1). Number of cells above the background fluorescence per field of view were analyzed. Each data point represents a field of view (n=20). Data were normalized against the WT average value. J. Relative level of SeV protein staining in infected cells (MOI=1). Corrected total cell fluorescence (CTCF) at 18 hpi. Each data point represents infected cell (n=200). Data were normalized against the WT average value. K. Schematic summarizing the dual function of SGs in (i) suppressing RLR signaling and (ii) restricting viral replication independent of the RLR pathway. Both functions converge on maintaining cell homeostasis. Data are presented in means ± SD. All data are representative of at least three independent experiments. p values were calculated using two-tailed unpaired Student’s t test (ns, p>0.05).
Figure 7.
Figure 7.. SGs suppress immune response to self-derived dsRNAs under the ADAR1 deficiency.
A. IF analysis of G3BP1 (green) and TIAR (red) in U2OS cells in the presence or absence of ADAR1 knock-down and IFNβ priming. Cells were transfected with siRNA for 24 hrs and then treated with IFNβ (10 ng/ml) for additional 24 hrs prior to imaging. B. Antiviral signaling in U2OS cells upon ADAR1 knock-down. Data were normalized to WT cells in the presence of IFNβ priming and ADAR1 knock-down. C. Cell death upon ADAR1 knock-down, as measured by brightfield images (left) and Sytox uptake (right). D. Effect of anti-TNF and pan-caspase inhibitor (Q-VD-Oph) on cell death upon ADAR1 knock-down. E. Antiviral signaling and cell death upon ADAR1 knock-down in U2OS cells. All samples were treated with IFNβ (10 ng/ml). Data were normalized to WT cells in the presence of ADAR1 knock-down. F. Schematic summarizing the roles of SGs in protecting cells from dsRNA. SGs suppress a broad range of dsRNA-triggered innate immune pathways (RLR, PKR and OASes), regardless of the origin of dsRNA. In particular, SGs slow down the ramp-up speed of RLR signaling and help maintain its magnitude below the “death” threshold. In the absence of SGs, RLRs are hyperactivated, leading to an excessive innate immune response and consequent cell death. The IRF3-IFN axis downstream of RLR-MAVS does not contribute to cell death and often displays a dynamic temporal behavior characterized by a sharp peak followed by a strong decline due to caspase-dependent feedback regulation. Data are presented in means ± SD. p values were calculated using two-tailed unpaired Student’s t test (ns, p>0.05). All data are representative of three independent experiments.

Similar articles

Cited by

References

    1. tenOever BR (2016). The Evolution of Antiviral Defense Systems. Cell Host Microbe 19, 142–149. 10.1016/j.chom.2016.01.006. - DOI - PubMed
    1. Weber F, Wagner V, Rasmussen SB, Hartmann R, and Paludan SR (2006). Double-stranded RNA is produced by positive-strand RNA viruses and DNA viruses but not in detectable amounts by negative-strand RNA viruses. J Virol 80, 5059–5064. 10.1128/JVI.80.10.5059-5064.2006. - DOI - PMC - PubMed
    1. Son K-N, Liang Z, and Lipton HL (2015). Double-Stranded RNA Is Detected by Immunofluorescence Analysis in RNA and DNA Virus Infections, Including Those by Negative-Stranded RNA Viruses. J. Virol 89, 9383–9392. - PMC - PubMed
    1. Stok JE, Vega Quiroz ME, and van der Veen AG (2020). Self RNA Sensing by RIG-I-like Receptors in Viral Infection and Sterile Inflammation. J Immunol 205, 883–891. 10.4049/jimmunol.2000488. - DOI - PubMed
    1. Chen YG, and Hur S (2022). Cellular origins of dsRNA, their recognition and consequences. Nat Rev Mol Cell Biol 23, 286–301. 10.1038/s41580-021-00430-1. - DOI - PMC - PubMed

Publication types

MeSH terms

LinkOut - more resources