. 2022 Oct 28;50(19):10947-10963.
doi: 10.1093/nar/gkac885.

Integrated multi-omics approach revealed cellular senescence landscape

Affiliations

Integrated multi-omics approach revealed cellular senescence landscape

Qiao Song et al. Nucleic Acids Res. .

Abstract

Cellular senescence is a complex multifactorial biological phenomenon that plays essential roles in aging, and aging-related diseases. During this process, the senescent cells undergo gene expression altering and chromatin structure remodeling. However, studies on the epigenetic landscape of senescence using integrated multi-omics approaches are limited. In this research, we performed ATAC-seq, RNA-seq and ChIP-seq on different senescent types to reveal the landscape of senescence and identify the prime regulatory elements. We also obtained 34 key genes and deduced that NAT1, PBX1 and RRM2, which interacted with each other, could be the potential markers of aging and aging-related diseases. In summary, our work provides the landscape to study accessibility dynamics and transcriptional regulations in cellular senescence. The application of this technique in different types of senescence allows us to identify the regulatory elements responsible for the substantial regulation of transcription, providing the insights into molecular mechanisms of senescence.


Figures

Figure 1.
Figure 1.
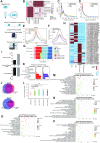
High­resolution chromatin accessibility profiles revealed differences between growing and senescent cells. (A) Graphical explanation of ATAC­seq process. (B) Unbiased clustering of RS (Replicative Cellular Senescence) cells, OIS (Oncogene Induced Senescence) cells, and corresponding control replicates. This picture was created with ‘BioRender.com’. (C) Distribution of ATAC­seq fragment size in RS cells and growing cells. (D) The position of THSSs (Tn5 hypersensitive set regions) in RS cells and growing cells can be observed in density plot. Enrichment of ATAC­ seq signal around the (E) TSS (transcription start site) and (F) gene center in RS cells and growing cells. (G) The annotation of accessible chromatin in Genome can be observed in it, the genomic features including exons, intergenic regions, introns, promoters, 3’UTR, and 5’UTR. (H) Heatmap of 50 most enriched ATAC­seq peaks at accessible chromatin regions in RS cells. (I) Numbers of altered accessibility regions can be observed in bar plot. (J) Venn diagram revealed the homogeneity and heterogeneity between different types of senescence in terms of chromatin accessibility. (K) Annotation of opened and closed accessible regions in RS. (L) Genomic GC percentage of the accessible regions. (M) Pathways associated with highly accessible chromatin regions in RS cells shown as a bubble chart. The X­axis was Richfactor, which represents the level of enrichment. The cycle size represents the number of peaks in this GO (gene ontology) term. The color of cycle represents ­ lg(P-value). (N) GO terms associated with highly accessible chromatin regions in RS cells was shown as a bubble chart. (O) Pathways associated with less accessible chromatin regions in RS cells. (P) GO terms associated with less accessible chromatin regions in RS cells. The results of OIS could also be seen in Supplementary Figure S1.
Figure 2.
Figure 2.
Gene expression profiles revealed differences between growing and senescent cells. (A) PCA (Principal com­ ponent analysis) analysis of RS cells can be observed indicated. (B) Unbiased clustering of RS cells, OIS cells, and corresponding control replicates. (C) Differentially expressed genes of RS cells were shown as a volcano plot, in which upregulated genes are indicated by red dots, and downregulated genes are indicated by green dots. (D) Heatmap of the 50 genes with the most altered expression in RS cells. (E) GO terms associated with the expression of altered genes in RS cells. (F) Top 5 GO biological processes associated with upregulated genes in RS cells revealed by GSEA (Gene Set Enrichment Analysis) algorithm. (G) Top 5 GO biological processes associated with downregulated genes in RS cells revealed by GSEA algorithm. (H) Top 5 pathways associated with upregulated genes in RS cells revealed by GSEA algorithm. (I) Top 5 pathways associated with downregulated genes in RS cells revealed by GSEA algorithm. The results of OIS could also be seen in Supplementary Figure S2.
Figure 3.
Figure 3.
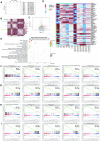
Association between chromatin accessibility and gene expression in senescence. ATAC­seq signal at TSSs correlates quantitatively with gene expression, (A) the left figures (in blue) show the correlation between ATAC­seq signal at TSS and gene expression in RS cells, (B) and the right figures (in brown) show the correlation between ATAC­ seq signal at TSS and gene expression in growing cells. (C) Regions of altered accessibility (opened or closed in RS or OIS) were assigned to nearby genes and matched with gene expression signals. (D) Venn diagram showing the genes associated with the chromatin��accessible regions in RS cells and differentially expressed genes. (E) Heatmap of the top 50 genes with highest chromatin accessibility and most altered expression in RS cells. (F) Upregulated genes in RS that are associated with open chromatin regions. (G) Downregulated genes in RS that are associated with open chromatin regions. (H) Upregulated genes in OIS that are associated with open chromatin regions. (I) Downregulated genes in OIS that are associated with open chromatin regions. (J) KEGG (Kyoto Encyclopedia of Genes and Genomes) pathways associated with accessibility and expression of simultaneously altered. The results of OIS could also be seen in Supplementary Figure S3.
Figure 4.
Figure 4.
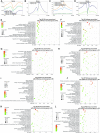
Characterization of epigenetic factors in senescence. (A) H3K4me1, (B) H3K4me3, (C) H3K27ac, (D) H3K27me3 distribution around TSS of each RS and control samples, in which the position of TSS were indicated. (E) GO terms associated with H3K4me1 enriched genes in RS cells. (F) Pathways associated with H3K4me1 enriched genes in RS cells. (G) GO terms associated with H3K4me3 enriched genes in RS cells. (H) Pathways associated with H3K27ac enriched genes in RS cells. (I) GO terms associated with H3K27ac enriched genes in RS cells. (J) Pathways associated with H3K27ac enriched genes in RS cells. (K) GO terms associated with H3K27me3 enriched genes in RS cells. (L) Pathways associated with H3K27me3 enriched genes in RS cells. The results of OIS could also be seen in Supplementary Figure S4.
Figure 5.
Figure 5.
Association between chromatin accessibility and epigenetic factors modification. (A) ChromHMM (Chromatin State Segmentation) analysis for a four­chromatin­state model based on hPTMs (histone post­translational modifications) enrichment patterns presented as heatmaps. The chromatin states were including TSS (enriched in H3K4me3 and depleted in H3K27me3), Depl (depleted in all hPTMs), Enhan (enriched in H3K4me1/H3K27ac and depleted in H3K4me3), and Uns (enriched in all hPTMs). Dark blue indicates the high enrichment of a particular hPTMs. (B) Overlap of various genomic features, including THSSs and known TSSs, between RS cells and growing cells shown as heatmaps, in which the predicted chromatin states can also be obtained. Dark blue indicates the high probability of pertinence to a particular chromatin state. (C) THSS regions (including TSS­like regions and enhancer­like regions) enrichment in H3K4me1/H3K4me3 was shown as violin plots. Log2 was used for the ratio scale. (D) The RS cells (top) and growing cells (bottom) enrichment of H3K4me1, H3K4me3, H3K27ac and H3K27me3 in THSS regions were shown as average profiles, in which chromatin states were divided into TSS (left) and enhancer­like (right). (E) RS cells distribution of distances to the ATG start codon for THSSs characterized as enhancers (left) or TSS­like (right) were shown as density diagrams. (F) The RS cells relationship between gene expression and chromatin accessibility at TSS­like regions and enhancer­like regions, which were identified by hPTMs, was shown as scatter plot. ATAC­seq data and RNA­seq data were in the log2 scale. Spearman rank correlation coefficient (rho) and corresponding p­value were shown as indicated. The results of OIS could also be seen in Supplementary Figure S5.
Figure 6.
Figure 6.
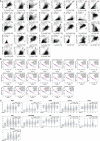
Appearance of ‘Simultaneous­Altered­Genes’ in cellular senescence and aging­related diseases. (A) Pearson's correlation of PBX1, NAT1, RRM2, ZNF214, C1ORF147, WTAPP1, PLA2G12A, FPGT, KIAA0895, BCAS3, CREG1, DYNC1I1, PDE11A, PPFIBP2, TNFSF13B, OAS2, SYT17, ACSS1 and DMC1 with cellular senescence markers indicated were shown, the data were extracted from GTEx database. We identified the significant correlation coefficient as P-­value < 0.05 and R > 0.3. These genes were significantly correlated with the indicated senescent markers, the else non­significant results of these genes could see in Supplementary Figure S6A. The correlations of other ‘Simultaneous­Altered­Genes’ (which were not correlated with any of the mentioned senescent markers) with senescent markers were shown in Supplementary Figure S6B. (B) Pan­Cancer DFS (Disease­Free Survival) plot of PBX1, NAT1, RRM2, ZNF214, DYNC1I1, GRIK2, ID2, OPRL1, PDE11A, PLA2G12A, PPFIBP2, PRSS35, RAI2, SERPINB4, SLC25A10, SLIT2, TNFSF8, TNFSF13B ACSS1, ATP2C2, BCAS3 and CREG1 were shown indicated. Cox proportional hazard ratio and 95% CI information were included in the survival plot. The data were analyzed by log­rank test. The remaining non­significant genes of Pan­Cancer DFS are shown in Supplementary Figure S6C. (C) Pan­Cancer pathological stage plot of PBX1, NAT1, RRM2, ZNF214, OAS2, RAI2, KIAA0895, ID2, IL1B, SERPINB4, and ATP2C2 can been observed as indicated. The F­value of these genes was more than 20. The data were obtained from TCGA and GTEx (Genotype-Tissue Expression) databases. One­way ANOVA and log2 (TPM + 1) were used for the log scale. The genes which F­value were less than 20 could be observed in Supplementary Figure S6D. The results of non­significant genes could be observed in Supplementary Figure S6E.
Figure 7.
Figure 7.
Integrated multi­omics approach revealed that PBX1, NAT1, and RRM2 could be the new markers of cellular senescence, aging, and aging­related diseases. (A) The genes, whose chromatin accessibility and expression were both altered in RS and OIS, were divided into the following three parts: those correlated with cellular senescence markers (left), those statistically significant in Pan­Cancer DFS (right), and those statistically significant in Pan­Cancer pathological stage (and F­value > 20) (bottom). The intersection of these three parts was shown in the Venn diagram. (B) Enrichment of NAT1, RRM2, and PBX1 in TSS­like regions (identified by H3K4me3, H3K27me3 and ATAC­seq), enhancer­like regions (identified by H3K4me1, H3K27ac, H3K4me3, and ATAC­seq), H3K4me3, H3K27me3, H3K4me1, H3K27ac and ATAC­seq were shown by IGV (Integrative Genomics Viewer). Light blue represents the growing cells, and dark blue indicates the RS cells. The results of OIS could also be seen in Supplementary Figure S7. The expression of NAT1, PBX1, and RRM2 in the peripheral blood mononuclear cells (PBMCs) of (C) the healthy people in different ages (n = 20, age = 25.3 ± 1.53 years) (n = 20, age = 73.25 ± 2.22 years), (D) patients who suffered from stroke (n = 20, age = 74.65 ± 3.30 years), (E) patients with Pan­Cancer (n = 20, age = 73.05 ± 2.86 years) and (F) patients with diabetes (n = 20, age = 75.2 ± 2.33 years). (G) CoIP assay in healthy people PBMCs (n = 60, with no restriction of age) shows that PBX1, RRM2 and NAT1 can bind with each other.

Similar articles

Cited by

References

    1. He S., Sharpless N.E.. Senescence in health and disease. Cell. 2017; 169:1000–1011. - PMC - PubMed
    1. Calcinotto A., Kohli J., Zagato E., Pellegrini L., Demaria M., Alimonti A.. Cellular senescence: aging, cancer, and injury. Physiol. Rev. 2019; 99:1047–1078. - PubMed
    1. Avelar R.A., Ortega J.G., Tacutu R., Tyler E.J., Bennett D., Binetti P., Budovsky A., Chatsirisupachai K., Johnson E., Murray A.et al. .. A multidimensional systems biology analysis of cellular senescence in aging and disease. Genome Biol. 2020; 21:91. - PMC - PubMed
    1. Sati S., Bonev B., Szabo Q., Jost D., Bensadoun P., Serra F., Loubiere V., Papadopoulos G.L., Rivera-Mulia J.C., Fritsch L.et al. .. 4D Genome rewiring during oncogene-induced and replicative senescence. Mol. Cell. 2020; 78:522–538. - PMC - PubMed
    1. Uyar B., Palmer D., Kowald A., Murua E.H., Barrantes I., Moller S., Akalin A., Fuellen G.. Single-cell analyses of aging, inflammation and senescence. Ageing Res. Rev. 2020; 64:101156. - PMC - PubMed

Publication types

MeSH terms

LinkOut - more resources