. 2020 Aug;26(8):1271-1279.
doi: 10.1038/s41591-020-0926-0. Epub 2020 Jun 22.

A single-cell landscape of high-grade serous ovarian cancer

Affiliations

A single-cell landscape of high-grade serous ovarian cancer

Benjamin Izar et al. Nat Med. 2020 Aug.

Abstract

Malignant abdominal fluid (ascites) frequently develops in women with advanced high-grade serous ovarian cancer (HGSOC) and is associated with drug resistance and a poor prognosis1. To comprehensively characterize the HGSOC ascites ecosystem, we used single-cell RNA sequencing to profile ~11,000 cells from 22 ascites specimens from 11 patients with HGSOC. We found significant inter-patient variability in the composition and functional programs of ascites cells, including immunomodulatory fibroblast sub-populations and dichotomous macrophage populations. We found that the previously described immunoreactive and mesenchymal subtypes of HGSOC, which have prognostic implications, reflect the abundance of immune infiltrates and fibroblasts rather than distinct subsets of malignant cells2. Malignant cell variability was partly explained by heterogeneous copy number alteration patterns or expression of a stemness program. Malignant cells shared expression of inflammatory programs that were largely recapitulated in single-cell RNA sequencing of ~35,000 cells from additionally collected samples, including three ascites, two primary HGSOC tumors and three patient ascites-derived xenograft models. Inhibition of the JAK/STAT pathway, which was expressed in both malignant cells and cancer-associated fibroblasts, had potent anti-tumor activity in primary short-term cultures and patient-derived xenograft models. Our work contributes to resolving the HSGOC landscape3-5 and provides a resource for the development of novel therapeutic approaches.


Figures
Extended Figure 1.
Extended Figure 1.. Patient and sample characteristics
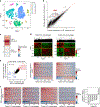
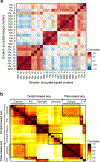
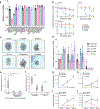
(a) Timing (x axis, days) of therapies (color blocks) and sample collection (arrows) in each patient (y axis). (b) Cell type composition does not group samples by treatment history. Proportion (color bar) of the four major cell types (columns) in each of the ascites samples (rows) profiled by droplet-based scRNA-seq. (c) Cell intrinsic profiles do not group samples by treatment history. Pearson correlation coefficient (color bar) between the mean profiles of cancer cells (left), CAF (middle) or macrophages (right) of each pair of samples (rows, columns) profiled by droplet-based scRNA-seq and having at least 20 cells in each type.
Extended Figure 2.
Extended Figure 2.. Clustering and characterization of malignant and non-malignant cell clusters in patient ascites by droplet scRNA-seq
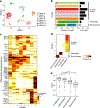
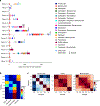
(a) t-stochastic neighborhood embedding (tSNE) of 9,609 droplet-based scRNA-seq profiles from 8 samples (as in Fig. 1b), colored by unsupervised cluster assignment. (b) Cluster 9 is an inflammatory subset of CAFs. Comparison of the average expression (log2(TPM+1)) of each gene in CAF cluster 9 (y axis) vs. CAF clusters 6 and 7 (x axis). Red: immunomodulatory genes. (c) CAF diversity observed within a single sample. Differential expression (log2(TPM+1)) between CAF8 and CAF6/7 cells in patient 5.1 only of the top up- and down- regulated genes from (b). (d-f) Two distinct macrophage programs. (d) Hierarchical clustering of macrophages (rows, columns) from cluster 10 from either Patient 5.0 (left) or Patient 6 (right). Shown are the Pearson correlation coefficients (color bar) between expression profiles of macrophages, ordered by the clustering. Yellow lines highlight the separation into two main clusters. (e) Left: Differential expression (log2(fold change)) for each gene (dot) between the two clusters identified in (d) for Patient 6 (x axis) or patient 5 (y axis), demonstrating high consistency. Top left corner: Pearson’s r. Genes significantly differentially up or down regulated in both patients are marked in red and blue, respectively. Middle and Right: Expression levels (color bar, log2(fold change)) of the highlighted differentially expressed genes from the left panel (rows) across macrophages from Patient 5 (middle) and Patient 6 (right) sorted by the hierarchical clustering of (d). (f) As in (e) for each other samples tested.
Extended Figure 3.
Extended Figure 3.. Consistent clusters among droplet and plate based scRNA-seq
(a) Pearson correlation coefficient (color bar) between the average expression profiles of 302 cluster marker genes in cells in clusters defined from either droplet-based or plate-based scRNA-seq (rows, columns; ordered by hierarchical clustering). (b) Pearson correlation coefficient of the mean profile of cell type specific clusters comparing droplet based and plate-based scRNA-seq.
Extended Figure 4.
Extended Figure 4.. Inferred CNA of single cells from plate based scRNA-seq profiles
Average relative copy number (color bar) in each chromosomal position (y axis) based on the average expression of the 100 genes surrounding that position in each cell in the malignant cell clusters 1–6 (x axis), compared to non-cancer clusters used as a reference, when using the original data (left) or when randomly ordering the genes across the genome and repeating the analysis (right), as control.
Extended Figure 5.
Extended Figure 5.. Mesenchymal and immunoreactive TCGA subtypes reflect CAFs and macrophages by comparison to droplet based scRNA-seq profiles
Subtype score (color bar), based on average expression of subtype-specific genes (Methods) of each cluster from the droplet-based scRNA-seq dataset (rows) for each of four TCGA subtypes (column). Only clusters with > 10 cells are represented in this figure.
Extended Figure 6.
Extended Figure 6.. A putative stemness program in Patient 7 modules
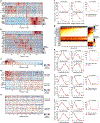
(a,b) Intra-tumoral expression modules in patients 7 and 5. Relative expression (color bar, Methods) of the top 30 module-specific genes (rows) in each module (ordered by module, dashed vertical lines), as defined by NMF (Methods) across all cancer cells (columns; ordered by hierarchical clustering) from patients 7 (a), or 5 (b, same as Fig. 4c). Selected genes are annotated. (c) Co-variation of stemness related genes in patient 7. Relative expression of three putative stemness markers (rows) in cells from patient 7, rank ordered by the cell’s average expression of the three markers. (d,e) Stemness related co-varying module present in patient 7 but not patient 8. Relative expression of the stemness score of patient 7 (top 20 genes (row) positively (top) or negatively (bottom)) correlated with the average expression of the three stemness genes in (c) in either cells from patient 7 (d) or patient 8 cells (e), with cells ordered by their average expression of the putative stemness score. (f) Stemness program is not detected in other ascites and primary tumor samples from our test cohort. Number of cells (y axis) expressing increasing numbers (x axis) of genes defining the stemness program from Patient 7 (CD24, CD133 (PROM1) and ALDH1A3) in patient cohort 3 (red) or expressing control genes with similar expression pattern in 10,000 simulations (g) Identification of cells expressing MHC Class II as cancer cells. Expression (color bar, log(TP100K+1)) of MHC Class II program, epithelial (cancer cell) markers, and macrophage markers (rows) in cancer cells (defined by marker expression and CNA) and macrophages (columns). Top panel: CNA signal, defined as the square of the inferred copy-number log-ratios, averaged across all genes. (h-j) MHC-II, cytokine and interferon programs are detected in other ascites and primary tumor samples from our test cohort. As in (f) for the three major immune programs defined as (h) MHC Class II (core genes (CD74, HLA-DRA, HLA-DRB1, HLA-DRB5, HLA-DMA, HLA-DPA1), (i) cytokines (core genes TNF, CXCL8, IL32, ICAM1, CCL2, CCL20, NFKBIA); and (j) interferon (IFN) program (core genes IFI6, IFI44, IFIT1, IFIT3, ISG15, MX1). Error bars: SD, *=p<0.05, **=p<0.001; empirical p-value is the fraction of simulations in which an equal number of stemness-program genes are detected as expressed.
Extended Figure 7.
Extended Figure 7.. Some programs in malignant cells recur between patient ascites and PDX
(a) Congruent cancer cell profiles between patient and PDX cells. Left: Pearson correlation coefficient (color bar) between mean profiles (rows, columns) among major cell types discovered by plate-based scRNA-seq (cancer cells, macrophages and CAFs) in patient samples and three patient-derived xenograft models (DF20, DF68 and DF101). Right: Distribution of Pearson correlation coefficient (x axis) between different subsets. n=27 (8 patient samples and 19 PDX samples). (b-d) Intra-tumoral expression modules. Relative expression (color bar, Methods) of the top 30 module-specific genes (rows) in each module (ordered by module, dashed horizontal lines), as defined by NMF (Methods) across all cancer cells (columns; ordered by hierarchical clustering) from PDX models DF20 (b), DF68 (c), and DF101 (d). Selected genes are annotated. Top bar (b and c): cell of origin from individual mice. (e,f) Cell cycle and inflammatory/immune programs recur across PDX models. (e) Number of top genes (color bar) shared between pairs of patients (rows, ordered as in Fig. 3e) and PDX (columns; ordered by hierarchical clustering) modules. Top: origin of each PDX module. (f) Module membership in the top 30 (black) or 50 (grey) of selected genes (rows) from cell cycle (top), immune-related (middle), and other (bottom) modules across all modules (columns), ordered as in (e). All genes included were shared between a corresponding PDX module and patient ascites module. (g) Cytokine and MHC-II programs are only identified in patient samples. Median expression (x axis) and % of outlier highly expressing cells (y axis; average log2(TPM+1)>5 and more than 2 SD larger than the mean of all cells) of the cytokine (left) and MHC-II (right) programs in each patient (black) and PDX (blue) samples. N=25 (6 patient samples and 19 PDX samples).
Extended Figure 8.
Extended Figure 8.. On-target activity of JSI-124
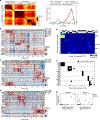
(a) Prominent expression of JAK-STAT pathway genes. Mean gene expression (x axis, log2(TPM+1)) and percentage of expressing cells (y axis) across the entire cell’s transcriptomes with highlighted signaling genes in patient cancer cells (top left), PDX models (top right), patient-derived CAFs (bottom left) and macrophages (bottom right). Black curve: LOWESS regression curve. Dark and light blue: top 5 and 10 percentiles calculated in a moving average of 200 genes. STAT3 activity induced by Oncostatin M. Relative (mean) luciferase activity (y axis) in Heya8 ovarian cancer cells transfected with a STAT3 responsive reporter that were stimulated with OSM to activate STAT3 for 6 hours (dark blue) or untreated (light blue) with either 1h pre-treatment with JSI-124 (1 μM) or vehicle (x axis) for 1 hour. p=0.09, t test. Error bars: SD. (c) JSI-124 treatment reduced pSTAT3. Cropped immunoblot (representative of duplicates; uncropped available in Source Data) of STAT3 and phosphorylated (p-)STAT3 from cells treated with 1μM JSI-124 for the indicated hours (bottom). Par=parental cell line, and R1 and R2 refer to two independently generated platinum-resistant cell lines.
Extended Figure 9.
Extended Figure 9.. Dose response of JSI-124 in 2D cultures or 3D spheroids
Relative (mean) viability (y axis, relative luminescence signal compared to DMSO control) of three ovarian cancer cell lines (labels, top) grown for 4 days in either ultra-low attachment conditions eliciting formation of spheroids (a) or in 2D cultures in regular plastic culture surfaces (b), and treated with JSI-124, carboplatin, paclitaxel, cisplatin or olaparib at indicated doses (x axis, log μM). Error bars: SD. n=4. Representative of biological duplicates.
Figure 1.
Figure 1.. Charting the ovarian cancer ascites landscape by scRNA-seq
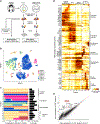
(a) Overview of sample collection and profiling strategy. (b,c) Malignant and non-malignant cell clusters in patient ascites by droplet-based scRNA-seq. (b) t-stochastic neighborhood embedding (tSNE) of 9,609 droplet-based scRNA-seq profiles from 8 samples, colored by sample-of-origin and numbered by unsupervised cluster assignment. (c) Fraction of cells (x axis) from each sample (color code, as in b) in each cluster (y axis). Clusters are labeled (right) by their post-hoc annotation based on differentially expressed genes (as in d). (d) Differentially expressed genes. Average expression (log2(TPM+1), color bar) of the top 30 genes (rows) that are differentially expressed in each cluster (columns). Genes are ordered by hierarchical clustering. (e) An inflammatory subset of CAFs. Comparison of the average expression (log2(TPM+1)) of each gene in CAF cluster 8 (y axis) vs. CAF clusters 6 and 7 (x axis). Red: immunomodulatory genes.
Figure 2.
Figure 2.. Malignant and non-malignant cell expression profiles help identify cellular basis of TCGA subtypes
(a,b) Malignant cell clusters are enriched in patient ascites by FACS and plate-based scRNA-seq. (a) tSNE of 1,297 single cell profiles from 14 ascites samples profiled by plate-based scRNA-seq, colored and numbered by unsupervised cluster assignment. (b) Fraction of cells (x axis) from each sample (color code, as in a) in each cluster (y axis). Clusters are labeled (right) by their post-hoc annotation based on differentially expressed genes (as in c). (c) Differentially expressed genes. Average expression (log2(TPM+1), color bar) of the top 30 genes (rows) that are differentially expressed in each cluster (columns). Genes are ordered by hierarchical clustering. (d) The immunoreactive and mesenchymal subtypes reflect macrophages and fibroblast components. Subtype score (color bar), based on average expression of subtype-specific genes (Methods) of each clusters (rows) for each of four TCGA subtypes (column). (e) Immunoreactive and mesenchymal TCGA subtypes have lower overall purity than differentiated and proliferative. Distribution of a purity estimate value (y axis, ABSOLUTE; Methods) for TCGA ovarian cancer tumors (n=282) in each subtype (x axis). Horizontal bar: mean; box: interquartile range, whiskers: minimum and maximum. Dots: outliers. ***p <10−10 (two-sided t test).
Figure 3.
Figure 3.. Inflammatory programs in malignant cells from patient ascites predict a role for JAK-STAT signaling
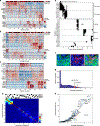
(a-c) Intra-tumoral expression modules. Relative expression (color bar, Methods) of the top 30 module-specific genes (rows) in each module (ordered by module, dashed horizontal lines), as defined by NMF (Methods) across all cancer cells (columns; ordered by hierarchical clustering) from patients 8 (a), 9 (b), or 10 (c). Selected genes are annotated. Top bar (a and b): sample time in 3 sequential samples from the same patient. (d,e) Cell cycle and inflammatory/immune programs recur across patients. (d) Number of top genes (color bar) shared between each pair of modules (rows and columns, ordered by hierarchical clustering). Top: module’s patient-of-origin. (e) Module membership in the top 30 (black) or 50 (grey) of selected cell cycle (top) and immune-related (bottom) genes (rows) across all modules (columns), ordered as in (d). (f) MHC-II expressing cancer cells in situ. Representative immunofluorescence staining of HGSOC primary tissue staining for nucleus (blue), pan-keratin (green) and MHC Class II (red). Size bar: 20μm. Overlay (right): co-expression of pan-keratin and MHC Class II, indicating cancer cell-autonomous expression of MHC Class II in a subset of cancer cells. (g,h) Broad and high expression of JAK-STAT pathway components across malignant cells. (g) Distribution of average expression of genes (x axis, log2(TPM+1)) for all detected genes (y axis). Red: STAT1/3 expression bin. (h) Mean expression (x axis, log2(TPM+1)) and percentage of expressing cells (y axis) of signaling genes. Key nodes of the JAK/STAT-pathway are labeled. Line: LOWESS regression curve.
Figure 4.
Figure 4.. JAK/STAT-inhibition reduces viability, spheroid formation, and invasion of HGSOC models ex vivo and in vitro
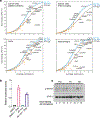
(a) JSI-124 reduces viability of in OVCAR4 ovarian cancer cell line. Relative (mean) viability compared to control in GILA (y axis) following 2 days of treatment of the OVCAR4 cell line with each of 14 inhibitors of the JAK/STAT-pathway, carboplatin and cisplatin (x axis). (**adjusted p=0.0032 for JSI-124, one-way ANOVA with Holm-Bonferroni correction with Holm-Šídák-extension). Error bars: SD, n=3. (b) JSI-124, but not other compounds routinely used for the treatment of ovarian cancer reduces mean viability of patient-derived ex vivo cultures. Percent viability relative to DMSO treated cells (y axis) in ex vivo cultures derived from patients 3, 5, and DF3291, each treated for 48 hours with increasing doses (x axis, μM) of JSI-124, carboplatin, cisplatin, paclitaxel, or olaparib. Error bars: SD, n=4. Representative of biological duplicates. (c,d) JSI-124 leads to spheroid disintegration. (c) Examples of light microscopy images of spheroids treated with indicated compounds (representative of biological triplicates). (d) Average number of spheroids (relative to DMSO treated control, y axis) formed with five established ovarian cancer cell lines (x axis) treated with two doses of JSI-124 (blue bars) or carboplatin (red bars) (*adjusted p<0.05, one-way ANOVA with Holm-Bonferroni correction with Holm-Šídák-extension). Error bars: SEM, n=3. (e,f) JSI-124 treatment reduces mesothelial clearance by patient-derived spheroids from patient-derived cultures and established cell lines. Mesothelial clearance (y axis) by patient derived cells (NACT8, e) treated with either JSI-124 (for 30 or 120 min) vs. DMSO, or by ovarian cancer cell lines OVCAR8 and TYKNU treated for 30 min. 20 spheroids clusters assessed per iteration. ** p<0.01 (one-way ANOVA and post hoc Tukey-Kramer test), two independent experiments with n=20 spheroids/condition. Horizontal bar: mean; box: interquartile range, whiskers: minimum and maximum. (g-j) JSI-124 prevents tumor growth and eliminates established tumors in PDX models. Mean log BLI signal (y axis, log total flux in p/s) from PDX mice injected with DF20 tumor cells and treated with either vehicle (black) or JSI-124 (red) and monitored over time (x axis, days). Error bars: SEM. N=5 mice per group. All statistical tests are two-sided t test comparing mean±SD at Day 15 of treatment. (g) Mice injected intraperitoneally (IP) and started treatment one week later for 14 days. ***p<0.0001. (h) Mice were injected IP, malignant ascites were allowed to form, and treatment started at 21 days, for a total of another 14 days. **p=0.002. (i) Mice injected subcutaneously (SC) and started treatment one week later for 14 days. ***p<0.0001. (j) Mice were injected SC, tumors were allowed to form, and treatment started at 21 days, for a total of another 14 days. **p=0.0028.

Similar articles

Cited by

References

    1. Matulonis UA et al. Ovarian cancer. Nat. Rev. Dis. Primer 2, 16061 (2016). - PMC - PubMed
    1. Network, T. C. G. A. R. Integrated genomic analyses of ovarian carcinoma. Nature 474, 609–615 (2011). - PMC - PubMed
    1. Winterhoff BJ et al. Single cell sequencing reveals heterogeneity within ovarian cancer epithelium and cancer associated stromal cells. Gynecol. Oncol 144, 598–606 (2017). - PMC - PubMed
    1. Shih AJ et al. Identification of grade and origin specific cell populations in serous epithelial ovarian cancer by single cell RNA-seq. PloS One 13, e0206785 (2018). - PMC - PubMed
    1. Hu Z et al. The Repertoire of Serous Ovarian Cancer Non-genetic Heterogeneity Revealed by Single-Cell Sequencing of Normal Fallopian Tube Epithelial Cells. Cancer Cell 37, 226–242.e7 (2020). - PubMed

Publication types

MeSH terms