Tetrahedral DNA nanostructures facilitate neural stem cell migration via activating RHOA/ROCK2 signalling pathway
- PMID: 30091500
- PMCID: PMC6528883
- DOI: 10.1111/cpr.12503
Tetrahedral DNA nanostructures facilitate neural stem cell migration via activating RHOA/ROCK2 signalling pathway
Erratum in
-
Corrigendum.Cell Prolif. 2021 Oct;54(10):e13120. doi: 10.1111/cpr.13120. Cell Prolif. 2021. PMID: 34605093 Free PMC article. No abstract available.
Abstract
Objectives: The main purpose of current study was to explore the effects of tetrahedral DNA nanostructures (TDNs) on neuroectodermal (NE-4C) stem cells migration and unveil the potential mechanisms.
Materials and methods: The successfully self-assembled TDNs were also determined by dynamic light scattering (DLS). A bidirectional wound-healing assay and transwell chamber assay were employed to test the migrating behaviour of NE-4C stem cells cultured under different conditions.
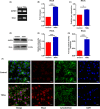
Results: Through an in vitro study, we found that stem cells could internalize TDNs quickly, and the cells' parallel and vertical migration was promoted effectively. Besides, the effects of TDNs were found being exerted by upregulating the gene and protein expression levels of RhoA, Rock2 and Vinculin, indicating that the RHOA/ROCK2 pathway was activated by the TDNs during the cell migration.
Conclusions: In conclusion, TDNs could enter NSCs without the aid of other transfection reagents in large amounts, whereas only small amounts of ssDNA could enter the cells. TDNs taken up by NSCs activated the RHOA/ROCK2 signalling pathway, which had effects on the relevant genes and proteins expression, eventually promoting the migration of NE-4C stem cells. These findings suggested that TDNs have great potential in application for the repair and regeneration of neural tissue.
© 2018 John Wiley & Sons Ltd.
Conflict of interest statement
All authors declare no competing financial interest.
Figures


Similar articles
-
Self-Assembled Tetrahedral DNA Nanostructures Promote Adipose-Derived Stem Cell Migration via lncRNA XLOC 010623 and RHOA/ROCK2 Signal Pathway.ACS Appl Mater Interfaces. 2016 Aug 3;8(30):19353-63. doi: 10.1021/acsami.6b06528. Epub 2016 Jul 21. ACS Appl Mater Interfaces. 2016. PMID: 27403707
-
Modulation of chondrocyte motility by tetrahedral DNA nanostructures.Cell Prolif. 2017 Oct;50(5):e12368. doi: 10.1111/cpr.12368. Epub 2017 Aug 9. Cell Prolif. 2017. PMID: 28792637 Free PMC article.
-
Self-Assembled Tetrahedral DNA Nanostructures Promote Neural Stem Cell Proliferation and Neuronal Differentiation.ACS Appl Mater Interfaces. 2018 Mar 7;10(9):7892-7900. doi: 10.1021/acsami.8b00833. Epub 2018 Feb 20. ACS Appl Mater Interfaces. 2018. PMID: 29424522
-
Applications of tetrahedral DNA nanostructures in wound repair and tissue regeneration.Burns Trauma. 2022 Mar 10;10:tkac006. doi: 10.1093/burnst/tkac006. eCollection 2022. Burns Trauma. 2022. PMID: 35280457 Free PMC article. Review.
-
Adoption of a Tetrahedral DNA Nanostructure as a Multifunctional Biomaterial for Drug Delivery.ACS Pharmacol Transl Sci. 2024 Jul 24;7(8):2204-2214. doi: 10.1021/acsptsci.4c00308. eCollection 2024 Aug 9. ACS Pharmacol Transl Sci. 2024. PMID: 39144555 Review.
Cited by
-
Advances in regenerative medicine applications of tetrahedral framework nucleic acid-based nanomaterials: an expert consensus recommendation.Int J Oral Sci. 2022 Oct 31;14(1):51. doi: 10.1038/s41368-022-00199-9. Int J Oral Sci. 2022. PMID: 36316311 Free PMC article. Review.
-
Tetrahedral framework nucleic acids for improving wound healing.J Nanobiotechnology. 2024 Mar 16;22(1):113. doi: 10.1186/s12951-024-02365-z. J Nanobiotechnology. 2024. PMID: 38491372 Free PMC article. Review.
-
Nanotherapeutic and Stem Cell Therapeutic Strategies in Neurodegenerative Diseases: A Promising Therapeutic Approach.Int J Nanomedicine. 2023 Feb 3;18:611-626. doi: 10.2147/IJN.S395010. eCollection 2023. Int J Nanomedicine. 2023. PMID: 36760756 Free PMC article. Review.
-
Engineered barriers regulate osteoblast cell migration in vertical direction.Sci Rep. 2022 Mar 15;12(1):4459. doi: 10.1038/s41598-022-08262-5. Sci Rep. 2022. PMID: 35292702 Free PMC article.
-
Self-Assembled DNA Nanostructure as a Carrier for Targeted siRNA Delivery in Glioma Cells.Int J Nanomedicine. 2021 Mar 3;16:1805-1817. doi: 10.2147/IJN.S295598. eCollection 2021. Int J Nanomedicine. 2021. PMID: 33692623 Free PMC article.
References
-
- Hoffman RM. Nestin‐expressing hair follicle‐accessible pluripotent stem cells for nerve and spinal cord repair. Cells Tissues Organs. 2014;200:42‐47. - PubMed
-
- Kim SU, Lee HJ, Kim YB. Neural stem cell‐based treatment for neurodegenerative diseases. Neuropathology. 2013;33:491‐504. - PubMed
-
- Nabetani M, Shintaku H, Hamazaki T. Future perspectives of cell therapy for neonatal hypoxic‐ischemic encephalopathy. Pediatr Res. 2017;83:356‐363. - PubMed
-
- Niimi Y, Levison SW. Pediatric brain repair from endogenous neural stem cells of the subventricular zone. Pediatr Res. 2017;83:385‐396. - PubMed
MeSH terms
Substances
Grants and funding
LinkOut - more resources
Full Text Sources
Other Literature Sources

