. 2017 May 16:8:15433.
doi: 10.1038/ncomms15433.

Non-cell-autonomous activation of IL-6/STAT3 signaling mediates FGF19-driven hepatocarcinogenesis

Affiliations

Non-cell-autonomous activation of IL-6/STAT3 signaling mediates FGF19-driven hepatocarcinogenesis

Mei Zhou et al. Nat Commun. .

Abstract

Hepatocellular carcinoma (HCC), a primary malignancy of the liver, is the second leading cause of cancer mortality worldwide. Fibroblast Growth Factor 19 (FGF19) is one of the most frequently amplified genes in HCC patients. Moreover, mice expressing an FGF19 transgene have been shown to develop HCC. However, the downstream signalling pathways that mediate FGF19-dependent tumorigenesis remain to be deciphered. Here we show that FGF19 triggers a previously unsuspected, non-cell-autonomous program to activate STAT3 signalling in hepatocytes through IL-6 produced in the liver microenvironment. We show that the hepatocyte-specific deletion of Stat3, genetic ablation of Il6, treatment with a neutralizing anti-IL-6 antibody or administration of a small-molecule JAK inhibitor, abolishes FGF19-induced tumorigenesis, while the regulatory functions of FGF19 in bile acid, glucose and energy metabolism remain intact. Collectively, these data reveal a key role for the IL-6/STAT3 axis in potentiating FGF19-driven HCC in mice, a finding which may have translational relevance in HCC pathogenesis.


Conflict of interest statement

All authors are employees and stockholders of NGM Biopharmaceuticals, Inc.

Figures
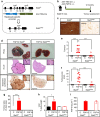
Figure 1
Figure 1. Hepatocyte-specific ablation of STAT3 eliminates FGF19-associated tumorigencity.
(a) Schematic representation of generating Stat3ΔHep mice with AAV-mediated delivery of Cre recombinase. The thyroxine binding globin (TBG) promoter drives hepatocyte-specific Cre expression. Exons in Stat3 gene are labelled. (b) Study design. 14 to 18 week-old Stat3f/f mice received a single tail vein injection of AAV-FGF19 (n=8), or a combination of AAV-FGF19 and AAV-TBG-Cre (n=8), or a control virus GFP (C) (n=5). Mice were killed 12 months after AAV administration for liver tumor analysis. (c) Confirmation of hepatocellular STAT3 ablation by immunohistochemical staining with anti-STAT3 followed by DAB substrates (brown colour). Abundant STAT3 proteins were detected in livers from Stat3f/f mice, but not Stat3ΔHep mice. Note residual STAT3 expression in non-parenchymal cell in Stat3ΔHep mice. Scale bars, 100 μm. (d) FGF19 induces HCC in Stat3f/f mice (n=8), but not Stat3ΔHep mice (n=8). Shown are representative macroscopic view, and liver sections stained with H&E or anti-glutamine synthetase. DAB substrates (brown colour) were used for immunohistochemistry. Tu, tumours. Scale bars, 5 mm. Higher magnifications of liver sections are shown in insets. (e) Liver tumour multiplicity. Dots in scatterplot represent individual animals. (f) Liver tumour size recorded as maximum tumour diameter in each mouse. (g) Quantification of glutamine synthetase-positive tumour area as a percentage of total liver area. (h) Liver weights from mice of the indicated genotypes. (i) Circulating levels of FGF19 at the end of the study. Values are mean±s.e.m. ***P<0.001, *P<0.05 by unpaired, two-tailed t-test of indicated groups.
Figure 2
Figure 2. Loss of STAT3 in hepatocytes does not impair FGF19-dependent metabolic improvements.
(a) Study design. 14 to 18 week-old Stat3f/f mice received a single tail vein injection of AAV-FGF19 (n=8), or a combination of AAV-FGF19 and AAV-TBG-Cre (n=8), or a control (C) virus (n=5). Mice were killed 12 months after AAV administration to determine expression of Cyp7a1 and Cyp8b1 in the liver. Body weight, blood glucose, and body composition were measured 1 month before euthanasia. (b) Hepatic Cyp7a1 mRNA levels. Data are normalized to housekeeping gene GAPDH, and are relative to the expression in Stat3f/f control mice. (c) Hepatic Cyp8b1 mRNA levels. (df) Body weight (d), plasma glucose (e) and body composition (f) were determined in live animals. Values are mean±s.e.m. ***P<0.001, **P<0.01, *P<0.05 by unpaired, two-tailed t-test of indicated groups.
Figure 3
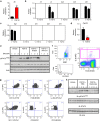
Figure 3. Non-cell-autonomous activation of hepatocellular STAT3 by FGF19.
(a) in vivo study design. 11–12-week old db/db mice received a single intraperitoneal injection of 1 mg kg−1 FGF19 or vehicle (saline), and livers were harvested 2 h post dose (n=5 per group). (b) Immunoblot analysis of pSTAT3Y705 in liver lysates of db/db mice treated with recombinant FGF19 protein. Anti-total-STAT3 and anti-β-actin serve as loading control. pERK and total ERK levels were also determined. (c) Primary hepatocytes were isolated by collagenase digestion followed by low-speed centrifugation and plating onto collagen-coated plates. (d) Lack of pSTAT3Y705 activation in primary mouse hepatocytes by FGF19. Cell lysates were prepared at the indicated time points following FGF19 stimulation and analysed for phosphorylation of the various proteins. Mouse IL-6 (mIL-6) was included as a positive control. (e) Lack of pSTAT3Y705 activation by FGF19 in primary human hepatocytes. Human IL-6 (hIL-6) was included as a positive control.
Figure 4
Figure 4. Non-cell-autonomous promotion of hepatocellular proliferation by FGF19.
(a) in vivo study design. Mice (n=5 per group) were implanted with osmotic pumps releasing BrdU (8.5 mg kg−1 day−1) and FGF19 protein (0.4 mg kg−1 day−1). Livers were harvested 6 days post implant. (b) BrdU incorporation in liver in vivo was revealed by staining with anti-BrdU antibody followed by DAB substrates (brown colour). Sections were counter-stained with hematoxylin. Scale bars, 100 μm. (c) Flow cytometry analysis of BrdU-labelled livers. Representative histograms from hepatocytes stained with anti-BrdU-APC and 7-AAD are shown. (d) BrdU-positive hepatocytes as a percentage of total hepatocytes from vehicle (V)-treated or FGF19-treated mice were quantified by flow cytometry. (e) Circulating FGF19 levels on day 6 post-implant of osmotic pumps. (f) Lack of proliferative effects of FGF19 on primary mouse hepatocytes. Primary cultures of hepatocytes isolated from mouse liver were incubated with recombinant FGF19 protein at indicated concentrations for 48 h, and BrdU was added during the last 24 h of incubation. BrdU incorporation was determined using a luminescence method. Mouse hepatocyte growth factor (mHGF) was included as a positive control. RLU, relative luminescence unit. (g) Lack of proliferative effects of FGF19 on primary human hepatocytes. Primary cultures of hepatocytes isolated from human liver were incubated with recombinant FGF19 protein. Human hepatocyte growth factor (hHGF) was included as a positive control. Data are represented as mean±s.e.m. **P<0.001 versus control group by unpaired, two-tailed t-test.
Figure 5
Figure 5. Identification of secreted factor(s) mediating non-cell-autonomous activation of STAT3 by FGF19.
(a) Hepatic IL-6 mRNA is induced in FGF19-treated db/db mice. 11∼12-week old db/db mice received an intraperitoneal injection of 1 mg kg−1 FGF19 or vehicle (V), and livers were harvested 2 h post dose (n=5 per group). (b) Lack of induction of canonical pSTAT3-activating cytokines, such as IL-11, LIF, OSM, CNTF and CTF-1, in FGF19-treated mice. (c) Lack of induction of additional pSTAT3-activating growth factors and cytokines, such as EGF, IL-10, IL-21, IL-22 and IL-31, in FGF19-treated mice. (d) Suppression of hepatic Cyp7a1 mRNA in FGF19-treated mice. (e) Blocking antibody against mouse IL-6 abolishes pSTAT3Y705 activation by FGF19. 11–12-week old db/db mice were injected intraperitoneally with a neutralizing anti-IL-6 antibody before FGF19 administration, and livers were harvested 2 h post FGF19 dose (n=3 per group). (f) Intracellular IL-6 cytokine staining of non-parenchymal cells analysed by flow cytometry. Representative forward scatter (FSC) and side scatter (SSC) plot of ungated cells is shown. Live cells were identified based on Live/Dead-DAPI staining (L/D). IL-6-positive cell gate (IL-6+) was used for subsequent analysis. (g) Co-localization of IL-6 with markers of myeloid cells (CD11b+), Kupffer cells (F4/80+), neutrophils (Ly6G+), NK cells (NK1.1+), but not T cells (CD3+) or B cells (CD19+). (h) Depletion of Kupffer cells reduces pSTAT3Y705 activation by FGF19. 11–12-week old db/db mice (n=4 per group) were injected intravenously with clodronate liposomes (to deplete Kupffer cells) or PBS liposomes. Livers were harvested 2 h post 1 mg kg−1 FGF19 dose. Values are mean±s.e.m. ***P<0.001 by unpaired, two-tailed t-test.
Figure 6
Figure 6. Homozygous deletion of IL-6 prevents FGF19-induced HCC development.
Il6+/+ or Il6−/− mice received a single tail vein injection of AAV-FGF19 or a control virus (C). Mice were killed after prolonged exposure to FGF19 for 12 months. (a) Representative images of livers from mice of the indicated genotypes are displayed. Liver tumours were assessed by H&E (middle panels) and anti-glutamine synthetase (GS, bottom panels, positive signal shown as brown colour) staining. Tu, tumours. Scale bars, 5 mm. Animal groups are Il6+/+control (n=5), Il6+/+FGF19 (n=5), Il6−/−control (n=8), Il6−/−FGF19 (n=9). (b) Numbers of macroscopic tumours per liver. Dots in scatterplot represent individual animals. (c) Tumour size. (d) Quantification of tumour area. (e) Ratios of liver-to-body weight. (f) Circulating FGF19 levels at the end of the study. (g) Body weight of the animals. (h) Quantitative RT-PCR of hepatic Cyp7a1 expression. (i) Hepatic Cyp8b1 mRNA levels. Values are mean±s.e.m. ***P<0.001, **P<0.01 versus control group by unpaired, two-tailed t-test.
Figure 7
Figure 7. Pharmacological inhibition of the STAT3/IL-6 axis abolishes FGF19-dependent HCC.
(a) Schematic diagram for AAV-SOCS3 study in db/db mice. 11∼12 week old db/db mice were i.v. administered with AAV-FGF19 with or without AAV-SOCS3, or a control (C) virus (n=5 per group). Mice were killed 24 weeks later for liver tumour analysis. (b) SOCS3 inhibits FGF19-induced liver tumour formation. (c) FGF19 normalizes HbA1c in db/db mice in the absence or presence of SOCS3. (d) Schematic diagram for tofacitinib study in db/db mice. 11∼12-week old db/db mice were i.v. administered with AAV-FGF19 or a control virus (n=5 per group). Tofacitinib treatment was initiated 4 weeks later. Mice were killed 24 weeks after AAV injection. (e) Tofacitinib inhibits FGF19-induced liver tumour formation. (f) FGF19 normalizes blood glucose levels in db/db mice irrespective of tofacitinib treatment. Dots in scatterplot represent individual animals. (g) Schematic diagram for anti-IL-6 study in Mdr2−/− mice. Mdr2−/− mice received a single tail vein injection of AAV-FGF19. Starting from week 14 after AAV injection, mice were dosed intraperitoneally (i.p.) with 10 mg kg−1 anti-mouse IL-6 (n=10) or an isotype control antibody (n=8) weekly (q.w.). Tumours were analysed 24 weeks after AAV administration. (h) Representative liver images and histological liver sections stained with H&E or anti-glutamine synthetase (brown). Tu, tumours. Scale bars, 5 mm. (i) Tumour multiplicity and tumour size. (j) Serum levels of alkaline phosphatase at the end of the study. (k) Serum levels of total bile acids. Values are mean±s.e.m. ***P<0.001, **P<0.01, *P<0.05 by unpaired two-tailed t-test when comparing two groups, or versus control group by one-way ANOVA when comparing multiple groups.
Figure 8
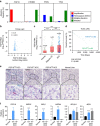
Figure 8. Overexpression of FGF19 and STAT3 target genes in human HCCs.
(a) Frequency of FGF19 genetic alterations in human HCCs from the Cancer Genome Atlas (TCGA) liver hepatocellular carcinomas (LIHC) database. Types of alterations include amplification, homozygous deletion, mutation and multiple alterations. Genetic alterations in genes encoding CTNNB1, PTEN and TP53 are shown for comparison. (b) Scatter plot of 17-09742 DNA copy number versus mRNA expression in TCGA LIHC data set. Spearman correlation coefficient (r) and P value are displayed. mRNA levels retrieved from RNA-seq data are expressed as Fragments Per Kilobase of transcript per Million mapped reads (FPKM). (c) Quantification of 17-09742 mRNA expression in HCC (n=374), adjacent non-tumour (NT) liver tissues (n=50), and normal livers (n=136). Box plots depict log2 gene expression levels of 17-09742 using TCGA LIHC (for HCCs and adjacent non-tumour tissues) and GTEx (for normal livers) RNA-seq data, showing median (horizontal line) and interquartile range (box). ***P<0.001 by Mann–Whitney test; NS, not statistically significant. (d) Kaplan–Meier survival curves of patients stratified by 17-09742 mRNA expression levels in TCGA LIHC data set. Patients were stratified into groups with high (greater than 75% rank) and low (less than 25% rank) 17-09742 expression. P value from log-rank test is shown. (e) Co-expression of FGF19 and BIRC5, a STAT3 target gene, in human HCC samples. Duplex RNAscope chromogenic in situ hybridization was performed on 83 formalin-fixed, paraffin-embedded human HCC samples and 10 normal livers. Slides were co-staining with probes specific for FGF19 (red) and BIRC5 (green), and counterstained with hematoxylin. Shown are representative images from HCC samples with high, low, or negative FGF19 expression, and normal liver samples. Scale bars, 100 μm. (f) Upregulation of STAT3 target genes (BIRC5, BCL2, HSPA4, BCL2L1 and MCL1) in FGF19-expressing human HCCs. Quantitative RT-PCR was performed on RNA extracted from frozen FGF19-expressing (19+) human HCC samples (n=5), FGF19-non-expressing (19−) human HCC samples (n=5), or normal livers (n=5). Values are mean±s.e.m. ***P<0.001, **P<0.01 by one-way ANOVA.

Similar articles

Cited by

References

    1. Llovet J. M. et al.. Hepatocellular carcinoma. Nat. Rev. Dis. Primers 2, 16018 (2016). - PubMed
    1. El-Serag H. B. Hepatocellular carcinoma. N. Engl. J. Med. 365, 1118–1127 (2011). - PubMed
    1. Sun B. & Karin M. Obesity, inflammation, and liver cancer. J. Hepatol. 56, 704–713 (2012). - PMC - PubMed
    1. Michelotti G. A., Machado M. V. & Diehl A. M. NAFLD, NASH and liver cancer. Nat. Rev. Gastroenterol. Hepatol. 10, 656–665 (2013). - PubMed
    1. Zucman-Rossi J., Villanueva A., Nault J. C. & Llovet J. M. Genetic landscape and biomarkers of hepatocellular carcinoma. Gastroenterology 149, 1226–1239 e1224 (2015). - PubMed

Publication types

MeSH terms