. 2012 Sep 15;73(1):115-80.
doi: 10.3114/sim0011. Epub 2012 Aug 27.

The Colletotrichum gloeosporioides species complex

Affiliations

The Colletotrichum gloeosporioides species complex

B S Weir et al. Stud Mycol. .

Abstract

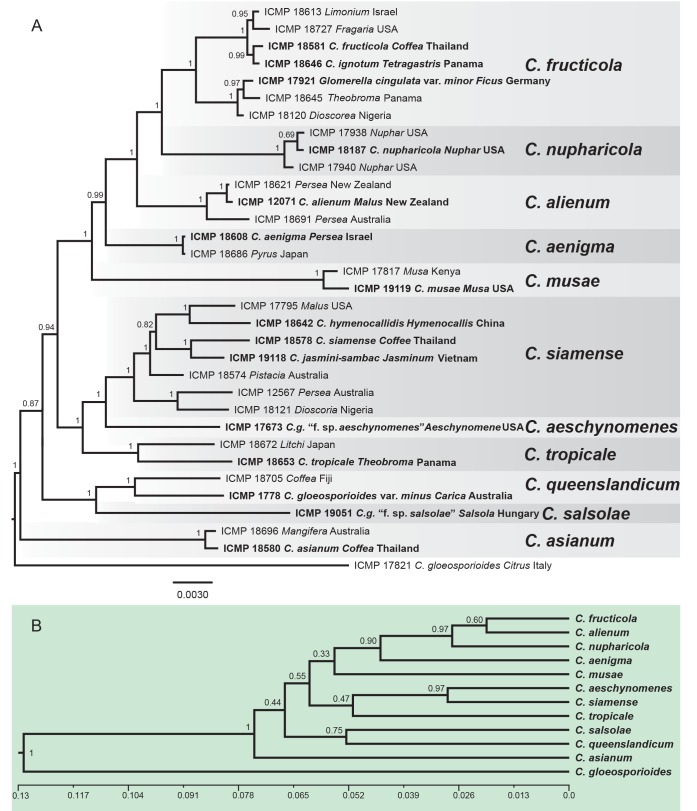
The limit of the Colletotrichum gloeosporioides species complex is defined genetically, based on a strongly supported clade within the Colletotrichum ITS gene tree. All taxa accepted within this clade are morphologically more or less typical of the broadly defined C. gloeosporioides, as it has been applied in the literature for the past 50 years. We accept 22 species plus one subspecies within the C. gloeosporioides complex. These include C. asianum, C. cordylinicola, C. fructicola, C. gloeosporioides, C. horii, C. kahawae subsp. kahawae, C. musae, C. nupharicola, C. psidii, C. siamense, C. theobromicola, C. tropicale, and C. xanthorrhoeae, along with the taxa described here as new, C. aenigma, C. aeschynomenes, C. alatae, C. alienum, C. aotearoa, C. clidemiae, C. kahawae subsp. ciggaro, C. salsolae, and C. ti, plus the nom. nov. C. queenslandicum (for C. gloeosporioides var. minus). All of the taxa are defined genetically on the basis of multi-gene phylogenies. Brief morphological descriptions are provided for species where no modern description is available. Many of the species are unable to be reliably distinguished using ITS, the official barcoding gene for fungi. Particularly problematic are a set of species genetically close to C. musae and another set of species genetically close to C. kahawae, referred to here as the Musae clade and the Kahawae clade, respectively. Each clade contains several species that are phylogenetically well supported in multi-gene analyses, but within the clades branch lengths are short because of the small number of phylogenetically informative characters, and in a few cases individual gene trees are incongruent. Some single genes or combinations of genes, such as glyceraldehyde-3-phosphate dehydrogenase and glutamine synthetase, can be used to reliably distinguish most taxa and will need to be developed as secondary barcodes for species level identification, which is important because many of these fungi are of biosecurity significance. In addition to the accepted species, notes are provided for names where a possible close relationship with C. gloeosporioides sensu lato has been suggested in the recent literature, along with all subspecific taxa and formae speciales within C. gloeosporioides and its putative teleomorph Glomerella cingulata.

Taxonomic novelties: Name replacement - C. queenslandicum B. Weir & P.R. Johnst. New species - C. aenigma B. Weir & P.R. Johnst., C. aeschynomenes B. Weir & P.R. Johnst., C. alatae B. Weir & P.R. Johnst., C. alienum B. Weir & P.R. Johnst, C. aotearoa B. Weir & P.R. Johnst., C. clidemiae B. Weir & P.R. Johnst., C. salsolae B. Weir & P.R. Johnst., C. ti B. Weir & P.R. Johnst. New subspecies - C. kahawae subsp. ciggaro B. Weir & P.R. Johnst. Typification: Epitypification - C. queenslandicum B. Weir & P.R. Johnst.

Keywords: Ascomycota; Colletotrichum gloeosporioides; Glomerella cingulata; anthracnose; barcoding; phylogeny; systematics.


Figures

Fig. 1.
Fig. 1.
A Bayesian inference phylogenetic tree of 156 isolates in the Colletotrichum gloeosporioides species complex. The tree was built using concatenated sequences of the ACT, CAL, CHS-1, GAPDH, and ITS genes each with a separate model of DNA evolution. Bayesian posterior probability values ≥ 0.5 are shown above nodes. Culture accession numbers are listed along with host plant genus and country of origin. Ex-type and authentic cultures are emphasised in bold font, and include the taxonomic name as originally described. Species delimitations are indicated with grey boxes. Colletotrichum boninense and C. hippeastri isolates are used as outgroups. The scale bar indicates the number of expected changes per site.
Fig. 1.
Fig. 1.
A Bayesian inference phylogenetic tree of 156 isolates in the Colletotrichum gloeosporioides species complex. The tree was built using concatenated sequences of the ACT, CAL, CHS-1, GAPDH, and ITS genes each with a separate model of DNA evolution. Bayesian posterior probability values ≥ 0.5 are shown above nodes. Culture accession numbers are listed along with host plant genus and country of origin. Ex-type and authentic cultures are emphasised in bold font, and include the taxonomic name as originally described. Species delimitations are indicated with grey boxes. Colletotrichum boninense and C. hippeastri isolates are used as outgroups. The scale bar indicates the number of expected changes per site.
Fig. 2.
Fig. 2.
An unrooted Bayesian inference phylogenetic tree of ex-type and authentic cultures of the 24 taxa within the Colletotrichum gloeosporioides species complex, illustrating their relative genetic distances, as indicated by branch lengths. There are two clusters within the species complex, the ‘Musae clade’ and the ‘Kahawae clade’. The tree was build using concatenated sequences of the ACT, TUB2, CAL, CHS-1, GAPDH, GS, ITS, and SOD2 genes each with a separate model of DNA evolution.
Fig. 3.
Fig. 3.
A Bayesian inference species-tree of the C. gloeosporioides species complex. The tree was built by grouping all 158 isolates into species and simultaneously estimating the individual five gene trees (ACT, CAL, CHS-1, GAPDH, and ITS) and the summary species tree using BEAST. The scale is an uncalibrated clock set relative to the last common ancestor of the C. gloeosporioides and C. boninense species complexes.
Fig. 7.
Fig. 7.
Box plots showing the variation in length and width of conidia produced by the cultures examined in this study. The dashed lines show the mean length (16.74 μm) and width (5.1 μm) across the species complex (n = 1958).
Fig. 8.
Fig. 8.
Box plots showing the variation in length and width of ascospores produced by the cultures examined in this study. The dashed lines show the mean length (17.46 μm) and width (4.8 μm) across the species complex (n = 452).
Fig. 9.
Fig. 9.
A box plot of the diameter of cultures grown on PDA agar at 18 °C for 10 d. The dashed line shows the mean culture size (61.56 mm) across the species complex (n = 719). Note that the data is skewed by some fast growing cultures that reached the agar plate diam (85 mm) in under 10 d.
Fig. 4.
Fig. 4.
A Bayesian inference phylogenetic tree of 32 selected isolates in the Musae clade of the Colletotrichum gloeosporioides species complex. The tree was build using concatenated sequences of the ACT, TUB2, CAL, CHS-1, GAPDH, GS, ITS, and SOD2 genes each with a separate model of DNA evolution. Other details as per Fig.1. B. A species-tree constructed from the same data, the scale is an clock set relative to the last common ancestor of the Musae clade and C. gloeosporioides s. str., as calibrated in Fig. 3.
Fig. 10.
Fig. 10.
Colletotrichum aenigma. A, C, D, E, F. ICMP 18608 – ex-holotype culture. B. ICMP 18616. A–B. Cultures on PDA, 10 d growth from single conidia, from above and below. C–D. Conidia. E–F. Appressoria. Scale bar C = 20 μm. Scale bar of C applies to C–F.
Fig. 11.
Fig. 11.
Colletotrichum aeschynomenes. ICMP 17673 – ex-holotype culture. A–C. Appressoria. D. Conidiogenous cells. E. Conidia. F. Cultures on PDA, 10 d growth from single conidia, from above and below. Scale bar of A = 20 μm. Scale bar of A applies to A–E.
Fig. 12.
Fig. 12.
Colletotrichum alatae. ICMP 18122. A. Cultures on PDA, 10 d growth from single conidia, from above and below. B–C. Appressoria. D. Conidiogenous cells and conidia. E. Conidia. F. Setae. Scale bars B, F = 20 μm. Scale bar of B applies to B–E.
Fig. 13.
Fig. 13.
Colletotrichum alienum. A, E, F. ICMP 12071 – ex-holotype culture. B. ICMP 18703. C–D. ICMP 12068. G–I. ICMP 18691 (ex DAR 37820). A–B. Appressoria. C–D. Asci and ascospores. E. Conidia. F. Conidiogenous cells. G. Appressoria. H. Conidia. I. Conidiogenous cells. Scale bar D = 20 μm. Scale bar of D applies to A–I.
Fig. 14.
Fig. 14.
Colletotrichum alienum. A. ICMP 12071 – ex-holotype culture. B. ICMP 12068. C. ICMP 18691 (ex DAR 37820). A–C. Cultures on PDA, 10 days growth from single conidia, from above and below.
Fig. 15.
Fig. 15.
Colletotrichum aotearoa. A. ICMP 17324. B. ICMP 18529. C. ICMP 18548. D. 18532. E. ICMP 18540. A–C. Appressoria. D. Conidiogenous cells. E. Conidia. Scale bar A = 20 μm. Scale bar of A applies to A–E.
Fig. 16.
Fig. 16.
Colletotrichum aotearoa. A. ICMP 18537 – ex-holotype culture. B. ICMP 18548. C. ICMP 18532. D. ICMP 18740. E. ICMP 18533. F. ICMP 18530. A–F. Cultures on PDA, 10 d growth from single conidia, from above and below.
Fig. 17.
Fig. 17.
Colletotrichum asianum. A. ICMP 18648 (ex CBS 124960). B. ICMP 18580 (ex MFLU 090234). C. ICMP 18603 (ex MAFF 306627). D. ICMP 18604 (ex HKUCC 18602). E. ICMP 18696 (ex IMI 313839). A–E. Cultures on PDA, 10 d growth from single conidia, from above and below.
Fig. 18.
Fig. 18.
Glomerella cingulata “f. sp. camelliae”. A, C, D. ICMP 10643. B, E. ICMP 10646. A–B. Appressoria. C. Conidiogenous cells. D–E. Conidia. Scale bar A = 20 μm. Scale bar of A applies to A–E.
Fig. 19.
Fig. 19.
Glomerella cingulata “f. sp. camelliae”. A. ICMP 18542. B. ICMP 10643. C. ICMP 10646. A–C. Cultures on PDA, 10 d growth from single conidia, from above and below.
Fig. 20.
Fig. 20.
Colletotrichum clidemiae. A, B, E. ICMP 18658 – ex-holotype culture. C, D. ICMP 18706. A, D. Appressoria. B, C. Asci and ascospores. E. Conidia. Scale bar C = 20 μm. Scale bar of C applies to A–E.
Fig. 21.
Fig. 21.
Colletotrichum clidemiae. A. ICMP 18658 – ex-holotype culture. ICMP 18706. Cultures on PDA, 10 d growth from single conidia, from above and below.
Fig. 22.
Fig. 22.
Colletotrichum cordylinicola. ICMP 18579 (ex MFLUCC 090551 – ex-holotype culture). A. Cultures on PDA, 10 d growth from single conidia, from above and below.
Fig. 23.
Fig. 23.
Colletotrichum fructicola. A. ICMP 12568. B. ICMP 18615. C. ICMP 18581 (ex MFLU 090228 – ex-holotype culture of C. fructicola). D. ICMP 18610. E. ICMP 18646 (ex CBS 125379 – ex-holotype culture of C. ignotum). F. ICMP 17921 (ex CBS 238.49 – ex-holotype culture of G. cingulata var. minor). A–F. Cultures on PDA, 10 d growth from single conidia, from above and below.
Fig. 24.
Fig. 24.
Colletotrichum gloeosporioides. A. ICMP 17821 (ex IMI 356878 – ex-epitype culture). A. Cultures on PDA, 10 d growth from single conidia, from above and below.
Fig. 25.
Fig. 25.
Colletotrichum kahawae subsp. kahawae. A, E. ICMP 17905 (ex IMI 361501). B–C. ICMP 17816 (ex IMI 319418 – ex-holotype culture). C. ICMP 17915 (ex CBS 982.69). A–B. Appressoria. C. Conidia. D–E. Cultures on PDA, 10 d growth from single conidia, from above and below. Scale bar C = 20 μm. Scale bar of C applies to A–C.
Fig. 26.
Fig. 26.
Colletotrichum kahawae subsp. ciggaro. A. ICMP 12952. B, D. ICMP 17932 (ex CBS 112984). E, H. ICMP 17931 (ex IMI 359911). C, F. ICMP 18539 – ex-holotype culture. G. ICMP 18531. A–B. Asci and ascospores. C–D. Appressoria. E. Setae. F–H. Conidia. Scale bars A, E = 20 μm. Scale bar of A applies to A–D, F–H.
Fig. 27.
Fig. 27.
Colletotrichum kahawae subsp. ciggaro. A. ICMP 12953. B. ICMP 18534. C. ICMP 17922 (ex CBS 237.49 – ex-holotype culture of Glomerella cingulata var. migrans). D. ICMP 17932 (ex CBS 112984). E. ICMP 18539 – ex-holotype culture of C. kahawae subsp. ciggaro. F. ICMP 12952 – single ascospore cultures from single conidial isolate. Cultures on PDA, 10 d growth from single conidia, from above and below.
Fig. 28.
Fig. 28.
Colletotrichum musae. A. ICMP 12930. B. ICMP 18600. C. ICMP 17817 (ex IMI 52264). Cultures on PDA, 10 d growth from single conidia, from above and below.
Fig. 29.
Fig. 29.
Colletotrichum nupharicola. A. ICMP 17939 (ex CBS 470.96 – ex-holotype culture). B. ICMP 17938 (ex CBS 469.96). C. ICMP 18187 (ex CBS 472.96). Cultures on PDA, 10 d growth from single conidia, from above and below.
Fig. 30.
Fig. 30.
Colletotrichum psidii (ICMP 19120, ex CBS 145.29 – authentic culture). Cultures on PDA, 10 d growth from single hyphal tips, from above and below.
Fig. 31.
Fig. 31.
Colletotrichum queenslandicum. A, C, E. ICMP 1778 – ex-epitype culture. B, F. ICMP 1780. D, G. ICMP 12564. H. ICMP 18705. A–B. Appressoria. C–D. Conidia. E–H. Cultures on PDA, 10 d growth from single conidia, from above and below. Scale bar A = 20 μm. Scale bar of A applies to A–D.
Fig. 32.
Fig. 32.
Colletotrichum salsolae. A, C–H. ICMP 19051 – ex-holotype culture. B. BPI 878740 – holotype. A. Cultures on PDA, 10 d growth from single conidia, from above and below. B. Lesion on stem, dried type specimen. C. Conidiogenous cells. D–E. Conidia. F–G. Appressoria. Scale bars B = 1 mm, C = 20 μm. Scale bar of C applies to C–G.
Fig. 33.
Fig. 33.
Colletotrichum siamense. A. ICMP 18642 (ex CBS 125378 – ex-holotype culture of C. hymenocallidis). B. ICMP 18578 (ex MFLU 090230 – ex-holotype culture of C. siamense). C. ICMP 12565. D. ICMP 18574 (ex DAR 76934). E. ICMP 18618 (ex HKUCC 10881). F. ICMP 18121. Cultures on PDA, 10 d growth from single conidia, from above and below.
Fig. 34.
Fig. 34.
Colletotrichum theobromicola. A. ICMP 17957 (ex MUCL 42294 – ex-holotype culture of C. gloeosporioides f. stylosanthis). B. ICMP 17927 (ex CBS 142.31 – ex-epitype culture of C. fragariae). C. ICMP 17958 (ex MUCL 42295). D. ICMP 17895. E. ICMP 18567. F. ICMP 18566. Cultures on PDA, 10 d growth from single conidia, from above and below.
Fig. 35.
Fig. 35.
Colletotrichum ti. A. PDD 24881 – holotype. B. PDD 30206. C, D, F, H. ICMP 4832 – ex-holotype culture. E, G. ICMP 19444. A–B. Lesions on dried herbarium specimens. C–E. Appressoria. F. Conidia. G. Conidiogenous cells. H. Ascospores. Scale bars A = 1 mm, C = 20 μm. Scale bar of A applies to A–B, scale bar of C applies to C–H.
Fig. 36.
Fig. 36.
Colletotrichum ti. A. ICMP 19444. B. ICMP 4832 – ex-holotype culture. C. ICMP 5285. Cultures on PDA, 10 d growth from single conidia, from above and below.
Fig. 37.
Fig. 37.
Colletotrichum tropicale. A. ICMP 18653 (ex CBS 124949 – ex-holotype culture). B. ICMP 18651 (ex CBS 124943). C. ICMP 18672 (ex MAFF 239933). Cultures on PDA, 10 d growth from single conidia, from above and below.
Fig. 38.
Fig. 38.
Colletotrichum xanthorrhoeae. ICMP 17903 (ex BRIP 45094 – ex-holotype culture). A. Cultures on PDA, 10 d growth from single conidia, from above and below. B. Culture on PDA at 4 wk showing sectoring with variation in pigmentation and growth form. C–D. Asci and ascospores. E. Perithecial wall in squash mount. Scale bar C = 20 μm. Scale bar of C applies to C–E.
Fig. 5.
Fig. 5.
A Bayesian inference phylogenetic tree of 30 selected isolates in the Kahawae clade of the Colletotrichum gloeosporioides species complex. The tree was build using concatenated sequences of the ACT, TUB2, CAL, CHS-1, GAPDH, GS, ITS, and SOD2 genes each with a separate model of DNA evolution. Other details as per Fig.1. B. A species-tree constructed from the same data, the scale is a clock set relative to the last common ancestor of the Kahawae clade and C. gloeosporioides s. str., as calibrated in Fig. 3.
Fig. 6.
Fig. 6.
An UPGMA tree of ITS sequences from 156 isolates in the Colletotrichum gloeosporioides species complex. Isolate names have been replaced with species present in each clade. Species that are in monophyletic clades are emphasised in bold font to indicate those for which ITS barcoding is likely to work well. B: A 50 % majority-rule consensus Bayesian inference tree of the same data, showing the collapse of structure when analysed with a more robust method.

Similar articles

Cited by

References

    1. Aa HA van der. (1978). A leaf spot of Nymphaea alba in the Netherlands. Netherlands Journal of Plant Pathology 84: 109–115
    1. Abang MM, Winter S, Green KR, Hoffmann P, Mignouna HD, Wolf GA. (2002). Molecular identification of Colletotrichum gloeosporioides causing anthracnose of yam in Nigeria. Plant Pathology 51: 63–71
    1. Abang MM, Winter S, Mignouna HD, Green KR, Asiedu R. (2003). Molecular taxonomic, epidemiological and population genetic approaches to understanding yam anthracnose disease. African Journal of Biotechnology 2: 486–496
    1. Afanador-Kafuri L, Minz D, Maymon M, Freeman S. (2003). Characterisation of Colletotrichum isolates from tamarillo, passiflora, and mango in Colombia and identification of a unique species from the genus. Phytopathology 93: 579–587 - PubMed
    1. Aguileta G, Marthey S, Chiapello H, Lebrun MH, Rodolphe F, et al. (2008). Assessing the Performance of Single-Copy Genes for Recovering Robust Phylogenies Systematic Biology 57: 613–627 - PubMed

LinkOut - more resources