Coupled biophysical global ocean model and molecular genetic analyses identify multiple introductions of cryptogenic species
- PMID: 16103373
- PMCID: PMC1189321
- DOI: 10.1073/pnas.0503811102
Coupled biophysical global ocean model and molecular genetic analyses identify multiple introductions of cryptogenic species
Abstract
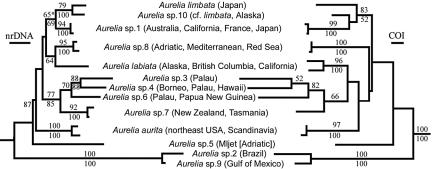
The anthropogenic introduction of exotic species is one of the greatest modern threats to marine biodiversity. Yet exotic species introductions remain difficult to predict and are easily misunderstood because knowledge of natural dispersal patterns, species diversity, and biogeography is often insufficient to distinguish between a broadly dispersed natural population and an exotic one. Here we compare a global molecular phylogeny of a representative marine meroplanktonic taxon, the moon-jellyfish Aurelia, with natural dispersion patterns predicted by a global biophysical ocean model. Despite assumed high dispersal ability, the phylogeny reveals many cryptic species and predominantly regional structure with one notable exception: the globally distributed Aurelia sp.1, which, molecular data suggest, may occasionally traverse the Pacific unaided. This possibility is refuted by the ocean model, which shows much more limited dispersion and patterns of distribution broadly consistent with modern biogeographic zones, thus identifying multiple introductions worldwide of this cryptogenic species. This approach also supports existing evidence that (i) the occurrence in Hawaii of Aurelia sp. 4 and other native Indo-West Pacific species with similar life histories is most likely due to anthropogenic translocation, and (ii) there may be a route for rare natural colonization of northeast North America by the European marine snail Littorina littorea, whose status as endemic or exotic is unclear.
Figures


Similar articles
-
New family of allomorphic jellyfishes, Drymonematidae (Scyphozoa, Discomedusae), emphasizes evolution in the functional morphology and trophic ecology of gelatinous zooplankton.Biol Bull. 2010 Dec;219(3):249-67. doi: 10.1086/BBLv219n3p249. Biol Bull. 2010. PMID: 21183445
-
Three routes to crypsis: Stasis, convergence, and parallelism in the Mastigias species complex (Scyphozoa, Rhizostomeae).Mol Phylogenet Evol. 2016 Jun;99:103-115. doi: 10.1016/j.ympev.2016.02.013. Epub 2016 Mar 8. Mol Phylogenet Evol. 2016. PMID: 26965984
-
Pleistocene isolation and recent gene flow in Haliotis asinina, an Indo-Pacific vetigastropod with limited dispersal capacity.Mol Ecol. 2007 Jan;16(2):289-304. doi: 10.1111/j.1365-294X.2006.03141.x. Mol Ecol. 2007. PMID: 17217345
-
A biophysical perspective on dispersal and the geography of evolution in marine and terrestrial systems.J R Soc Interface. 2008 Feb 6;5(19):135-50. doi: 10.1098/rsif.2007.1089. J R Soc Interface. 2008. PMID: 17626000 Free PMC article. Review.
-
The dynamics of biogeographic ranges in the deep sea.Proc Biol Sci. 2010 Dec 7;277(1700):3533-46. doi: 10.1098/rspb.2010.1057. Epub 2010 Jul 28. Proc Biol Sci. 2010. PMID: 20667884 Free PMC article. Review.
Cited by
-
JellyWeb: an interactive information system on Scyphozoa, Cubozoa and Staurozoa.Zookeys. 2016 Jan 18;(554):1-25. doi: 10.3897/zookeys.554.6745. eCollection 2016. Zookeys. 2016. PMID: 26877677 Free PMC article.
-
Where are the polyps? Molecular identification, distribution and population differentiation of Aurelia aurita jellyfish polyps in the southern North Sea area.Mar Biol. 2016;163:172. doi: 10.1007/s00227-016-2945-4. Epub 2016 Jul 18. Mar Biol. 2016. PMID: 27478251 Free PMC article.
-
A new species of Pseudomacrochiron Reddiah, 1969 (Crustacea: Copepoda: Macrochironidae) associated with scyphistomae of the moon jellyfish Aurelia sp. (Cnidaria: Scyphozoa) off Japan.Syst Parasitol. 2012 Feb;81(2):125-34. doi: 10.1007/s11230-011-9332-9. Epub 2011 Dec 20. Syst Parasitol. 2012. PMID: 22183922
-
Seasonal alternation of the ontogenetic development of the moon jellyfish Aurelia coerulea in Maizuru Bay, Japan.PLoS One. 2019 Nov 21;14(11):e0225513. doi: 10.1371/journal.pone.0225513. eCollection 2019. PLoS One. 2019. PMID: 31751435 Free PMC article.
-
Lagrangian betweenness as a measure of bottlenecks in dynamical systems with oceanographic examples.Nat Commun. 2021 Aug 16;12(1):4935. doi: 10.1038/s41467-021-25155-9. Nat Commun. 2021. PMID: 34400636 Free PMC article.
References
-
- Carlton, J. T. (1979) Ph.D. thesis (Univ. of California, Davis).
-
- Kramp, P. L. (1961) J. Mar. Biol. Assoc. U.K. 40, 1–469.
-
- Carlton, J. T. (1993) Am. Zool. 33, 499–509.
-
- Cowen, R. K., Lwiza, K. M. M., Sponaugle, S., Paris, C. B., Olson, D. B. (2000) Science 287, 857–859. - PubMed
-
- Longhurst, A. (1998) Ecological Geography of the Sea (Academic, San Diego).
Publication types
MeSH terms
Substances
Associated data
- Actions
- Actions
- Actions
- Actions
- Actions
- Actions
- Actions
- Actions
- Actions
- Actions
- Actions
- Actions
- Actions
- Actions
- Actions
- Actions
- Actions
- Actions
- Actions
- Actions
- Actions
- Actions
- Actions
- Actions
- Actions
- Actions
- Actions
- Actions
- Actions
- Actions
- Actions
- Actions
- Actions
- Actions
- Actions
- Actions
- Actions
- Actions
- Actions
- Actions
- Actions
- Actions
- Actions
- Actions
- Actions
- Actions
- Actions
- Actions
- Actions
- Actions
- Actions
- Actions
- Actions
- Actions
- Actions
- Actions
- Actions
- Actions
- Actions
- Actions
- Actions
- Actions
- Actions
- Actions
- Actions
- Actions
- Actions
- Actions
- Actions
- Actions
- Actions
- Actions
- Actions
- Actions
- Actions
- Actions
- Actions
- Actions
- Actions
- Actions
- Actions
- Actions
- Actions
- Actions
- Actions
- Actions
- Actions
- Actions
- Actions
- Actions
- Actions
- Actions
- Actions
- Actions
- Actions
- Actions
- Actions
- Actions
- Actions
- Actions
- Actions
- Actions
- Actions
- Actions
- Actions
- Actions
- Actions
- Actions
- Actions
- Actions
- Actions
- Actions
- Actions
- Actions
- Actions
- Actions
- Actions
- Actions
- Actions
- Actions
- Actions
- Actions
- Actions
- Actions
- Actions
- Actions
- Actions
- Actions
- Actions
- Actions
- Actions
- Actions
- Actions
- Actions
- Actions
- Actions
- Actions
- Actions
- Actions
- Actions
- Actions
- Actions
- Actions
- Actions
- Actions
- Actions
- Actions
- Actions
- Actions
- Actions
- Actions
- Actions
- Actions
- Actions
- Actions
- Actions
- Actions
- Actions
- Actions
- Actions
- Actions
- Actions
- Actions
- Actions
LinkOut - more resources
Full Text Sources
Other Literature Sources
Molecular Biology Databases
Research Materials