
Fichier:Atmospheric Transmission.png

Fichier d’origine (850 × 857 pixels, taille du fichier : 75 kio, type MIME : image/png)
Ce fichier et sa description proviennent de Wikimedia Commons.

|
Une version vectorielle de cette image existe, dans le format « SVG ». Si elle n’est pas inférieure, elle devrait être utilisée à la place de la présente version pour des affichages en plus grandes dimensions ou nécessitant une meilleure résolution.
File:Atmospheric Transmission.png → File:Atmospheric Transmission-en.svg
Pour plus d’informations sur les images vectorielles, consultez la page de transition de Commons vers le format SVG. Voir aussi les informations à propos de la manière dont le logiciel MediaWiki gère les images au format SVG. |
 |
Transwiki approved by: w:en:User:Dmcdevit
This image was copied from wikipedia:en. The original description was:
Description
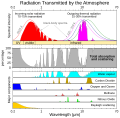
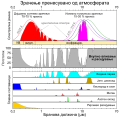
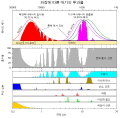
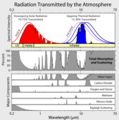
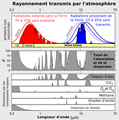
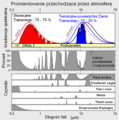
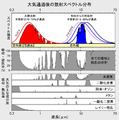
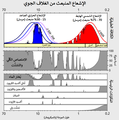
This figure shows the absorption bands in the Earth's atmosphere (middle panel) (when there are no clouds present: clouds average 60-65% cover and independently impact radiation transfer) and the effect that this has on both solar radiation and upgoing thermal radiation (top panel). Individual absorption spectrum for major greenhouse gases plus Rayleigh scattering are shown in the lower panel.
Both the Earth and the Sun emit electromagnetic radiation (e.g. light) that closely follows a blackbody spectrum, and which can be predicted based solely on their respective temperatures. For the Sun, these emissions peak in the visible region and correspond to a temperature of ~5500 K. Emissions from the Earth vary following variations in temperature across different locations and altitudes, but always peak in the infrared.
The position and number of absorption bands are determined by the chemical properties of the gases present. In the present atmosphere, water vapor is the most significant of these greenhouse gases, followed by carbon dioxide and various other minor greenhouse gases. In addition, Rayleigh scattering, the physical process that makes the sky blue, also disperses some incoming sunlight. Collectively these processes capture and redistribute 25-30% of the energy in direct sunlight passing through the atmosphere. By contrast, the greenhouse gases capture 70-85% of the energy in upgoing thermal radiation emitted from the Earth surface.
Data sources and notes
The data used for these figures is based primarily on Spectral Calculator of GATS, Inc. copie d'archive sur Wayback Machine which implements the LINEPAK system of calculating absorption spectra (Gordley et al. 1994) from the HITRAN2004 (Rothman et al. 2004) spectroscopic database. To aid presentation, the absorption spectra were smoothed. Features with a bandwidth narrower than 0.5% of their wavelength may be obscured.
Calculations were done on the assumption of direct vertical transmission through an atmosphere with gas concentrations representative of modern day averages. In particular, absorption would be greater for radiation traveling obliquely through the atmosphere as it would encounter more gas.
The total scattering and absorption curve includes only the components indicated in the lower panel. These represent the vast majority of absorption contributing to the greenhouse effect and follow the treatment of Peixoto and Oort (1992), but other minor species such as carbon monoxide, nitric oxide and chloroflourocarbons (CFCs) have been omitted. Also omitted was scattering due to aerosols and other sources besides Rayleigh scattering.
The peaks in the blackbody spectra were adjusted to have the same height for ease in presentation.
Copyright
This figure was prepared by Robert A. Rohde for the Global Warming Art project.

|
Vous avez la permission de copier, distribuer et modifier ce document selon les termes de la GNU Free Documentation License version 1.2 ou toute version ultérieure publiée par la Free Software Foundation, sans sections inaltérables, sans texte de première page de couverture et sans texte de dernière page de couverture. Un exemplaire de la licence est inclus dans la section intitulée GNU Free Documentation License. |
| Ce fichier est disponible selon les termes de la licence Creative Commons Attribution – Partage dans les Mêmes Conditions 3.0 (non transposée). | ||
| ||
| Ce bandeau de licence a été ajouté à ce fichier dans le cadre de la procédure de mise à jour des licences des images sous GFDL. |
References
- Gordley, Larry L., Benjamin T. Marshall, Allen D. Chu (1994). "LINEPAK: Algorithms for modeling spectral transmittance and radiance". Journal of Quantitative Spectroscopy & Radiative Transfer 52 (5): 563-580. DOI:10.1016/0022-4073(94)90025-6.
- L.S. Rothman, D. Jacquemart, A. Barbe, D. Chris Benner, M. Birk, L.R. Brown, M.R. Carleer, C. Chackerian Jr., K. Chance, L.H. Coudert, V. Dana, V.M. Devi, J.-M. Flaud, R.R. Gamache, A. Goldman, J.-M. Hartmann, K.W. Jucks, A.G. Maki, J.-Y. Mandin, S.T. Massie, J. Orphal, A. Perrin, C.P. Rinsland, M.A.H. Smith, J. Tennyson, R.N. Tolchenov, R.A. Toth, J. Vander Auwera, P. Varanasi, G. Wagner (2004). "The HITRAN 2004 molecular spectroscopic database". Journal of Quantitative Spectroscopy & Radiative Transfer 96: 139-204.
- Peixoto, Jose P. and Abraham H. Oort (1992) Physics of Climate, Springer ISBN : 0883187124.
Other versions
[]
.svg:
-
 anglais .svg
 -
 français .svg
 -
 macédonien .svg
 -
 russe .svg
 -
 coréen .svg


.png:
-
 anglais .png
 -
 français .png
 -
 polonais .png
 -
 japonais .png
 -
 arabe .png


Journal des téléversements d’origine
| date/time | username | resolution | size | edit summary |
|---|---|---|---|---|
| 22:55, 13 June 2007 | w:en:User:Dragons flight | 850×857 | 76,567 | ({{GWArt}}) |
Image description page history
| link | date/time | username | edit summary |
|---|---|---|---|
| http://en.wikipedia.org/w/index.php?title=Image:Atmospheric_Transmission.png&redirect=no&oldid=138013407 | 08:22, 25 August 2007 | w:en:User:Dmcdevit | |
| http://en.wikipedia.org/w/index.php?title=Image:Atmospheric_Transmission.png&redirect=no&oldid=138013407 | 23:00, 13 June 2007 | w:en:User:Dragons flight | |
| http://en.wikipedia.org/w/index.php?title=Image:Atmospheric_Transmission.png&redirect=no&oldid=138012501 | 22:55, 13 June 2007 | w:en:User:Dragons flight | ({{GWArt}}) |
| Annotations | Cette image est annotée : Voir les annotations sur Wikimedia Commons |
Historique du fichier
Cliquer sur une date et heure pour voir le fichier tel qu'il était à ce moment-là.
| Date et heure | Vignette | Dimensions | Utilisateur | Commentaire | |
|---|---|---|---|---|---|
| actuel | 25 août 2007 à 11:24 | | 850 × 857 (75 kio) | BetacommandBot | Transwiki approved by: w:en:User:Dmcdevit This image was copied from wikipedia:en. The original description was: == Description == [[w:en:Image:Greenhouse Effect.png|thumb|right|300px|Shows how the absorption and recycling of energy by the atmosphe |
Utilisation du fichier
La page suivante utilise ce fichier :
Usage global du fichier
Les autres wikis suivants utilisent ce fichier :
- Utilisation sur bg.wikipedia.org
- Utilisation sur bn.wikipedia.org
- Utilisation sur ca.wikipedia.org
- Utilisation sur cs.wikipedia.org
- Utilisation sur de.wikipedia.org
- Utilisation sur de.wikiversity.org
- Utilisation sur el.wikipedia.org
- Utilisation sur en.wikipedia.org
- Utilisation sur en.wikibooks.org
- Utilisation sur en.wikiversity.org
- Utilisation sur es.wikipedia.org
- Utilisation sur gu.wikipedia.org
- Utilisation sur he.wikipedia.org
- Utilisation sur hr.wikipedia.org
- Utilisation sur id.wikipedia.org
- Utilisation sur lb.wikipedia.org
- Utilisation sur ms.wikipedia.org
- Utilisation sur nn.wikipedia.org
- Utilisation sur no.wikipedia.org
- Utilisation sur ro.wikipedia.org
- Utilisation sur sh.wikipedia.org
- Utilisation sur si.wikipedia.org
- Utilisation sur ta.wikipedia.org
- Utilisation sur te.wikipedia.org
- Utilisation sur th.wikipedia.org
- Utilisation sur ur.wikipedia.org