Molecular taxonomy of phytopathogenic fungi: a case study in Peronospora
- PMID: 19641601
- PMCID: PMC2712678
- DOI: 10.1371/journal.pone.0006319
Molecular taxonomy of phytopathogenic fungi: a case study in Peronospora
Abstract
Background: Inappropriate taxon definitions may have severe consequences in many areas. For instance, biologically sensible species delimitation of plant pathogens is crucial for measures such as plant protection or biological control and for comparative studies involving model organisms. However, delimiting species is challenging in the case of organisms for which often only molecular data are available, such as prokaryotes, fungi, and many unicellular eukaryotes. Even in the case of organisms with well-established morphological characteristics, molecular taxonomy is often necessary to emend current taxonomic concepts and to analyze DNA sequences directly sampled from the environment. Typically, for this purpose clustering approaches to delineate molecular operational taxonomic units have been applied using arbitrary choices regarding the distance threshold values, and the clustering algorithms.
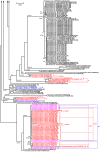
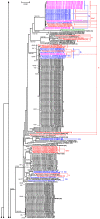
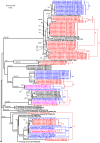
Methodology: Here, we report on a clustering optimization method to establish a molecular taxonomy of Peronospora based on ITS nrDNA sequences. Peronospora is the largest genus within the downy mildews, which are obligate parasites of higher plants, and includes various economically important pathogens. The method determines the distance function and clustering setting that result in an optimal agreement with selected reference data. Optimization was based on both taxonomy-based and host-based reference information, yielding the same outcome. Resampling and permutation methods indicate that the method is robust regarding taxon sampling and errors in the reference data. Tests with newly obtained ITS sequences demonstrate the use of the re-classified dataset in molecular identification of downy mildews.
Conclusions: A corrected taxonomy is provided for all Peronospora ITS sequences contained in public databases. Clustering optimization appears to be broadly applicable in automated, sequence-based taxonomy. The method connects traditional and modern taxonomic disciplines by specifically addressing the issue of how to optimally account for both traditional species concepts and genetic divergence.
Conflict of interest statement
Figures


Similar articles
-
Phylogeny of Peronospora, parasitic on Fabaceae, based on ITS sequences.Mycol Res. 2008 May;112(Pt 5):502-12. doi: 10.1016/j.mycres.2007.10.007. Epub 2007 Nov 1. Mycol Res. 2008. PMID: 18406121
-
Multi-locus tree and species tree approaches toward resolving a complex clade of downy mildews (Straminipila, Oomycota), including pathogens of beet and spinach.Mol Phylogenet Evol. 2015 May;86:24-34. doi: 10.1016/j.ympev.2015.03.003. Epub 2015 Mar 12. Mol Phylogenet Evol. 2015. PMID: 25772799 Free PMC article.
-
A Clustering Optimization Strategy for Molecular Taxonomy Applied to Planktonic Foraminifera SSU rDNA.Evol Bioinform Online. 2010 Sep 9;6:97-112. doi: 10.4137/ebo.s5504. Evol Bioinform Online. 2010. PMID: 21037964 Free PMC article.
-
Advances in Diagnostics of Downy Mildews: Lessons Learned from Other Oomycetes and Future Challenges.Plant Dis. 2018 Feb;102(2):265-275. doi: 10.1094/PDIS-09-17-1455-FE. Epub 2018 Jan 5. Plant Dis. 2018. PMID: 30673522 Review.
-
Basil Downy Mildew (Peronospora belbahrii): Discoveries and Challenges Relative to Its Control.Phytopathology. 2015 Jul;105(7):885-94. doi: 10.1094/PHYTO-02-15-0032-FI. Epub 2015 Jul 9. Phytopathology. 2015. PMID: 25894318 Review.
Cited by
-
Globally Distributed Arbuscular Mycorrhizal Fungi Associated With Invasive Cinchona pubescens on Santa Cruz Island, Galápagos.Ecol Evol. 2024 Oct 17;14(10):e70462. doi: 10.1002/ece3.70462. eCollection 2024 Oct. Ecol Evol. 2024. PMID: 39421329 Free PMC article.
-
Isolation and Characterization of Six Novel Fusobacterium necrophorum Phages.Phage (New Rochelle). 2024 Jun 21;5(2):63-75. doi: 10.1089/phage.2023.0028. eCollection 2024 Jun. Phage (New Rochelle). 2024. PMID: 39119211
-
Genomic characterization of SNW-1, a novel prophage of the deep-sea vent chemolithoautotroph Sulfurimonas indica NW79.Genet Mol Biol. 2024 Jul 29;47(2):e20230355. doi: 10.1590/1678-4685-GMB-2023-0355. eCollection 2024. Genet Mol Biol. 2024. PMID: 39093930 Free PMC article.
-
A diverse set of Enterococcus-infecting phage provides insight into phage host-range determinants.Virus Res. 2024 Sep;347:199426. doi: 10.1016/j.virusres.2024.199426. Epub 2024 Jul 4. Virus Res. 2024. PMID: 38960003 Free PMC article.
-
fENko-Kae01 is a flagellum-specific jumbo phage infecting Klebsiella aerogenes.BMC Microbiol. 2024 Jul 1;24(1):234. doi: 10.1186/s12866-024-03387-1. BMC Microbiol. 2024. PMID: 38951769 Free PMC article.
References
-
- Blaxter M, Floyd R. Molecular taxonomics for biodiversity surveys: already a reality. Trends Ecol Evol. 2003;18:268–269.
-
- Daniell TJ, Husband R, Fitter AH, Young JPW. Molecular diversity of arbuscular mycorrhizal fungi colonising arable crops. FEMS Microbiol Ecol. 2001;36:203–209. - PubMed
-
- Floyd R, Abebe E, Papert A, Blaxter M. Molecular barcodes for soil nematode identification. Mol Ecol. 2002;11:839–850. - PubMed
-
- Helgason T, Watson IJ, Young JPW. Phylogeny of the Glomerales and Diversisporales (Fungi: Glomeromycota) from actin and elongation factor 1-alpha sequences. FEMS Microbiol Ecol. 2003;229:127–132. - PubMed
Publication types
MeSH terms
Substances
LinkOut - more resources
Full Text Sources

